Alternatives Q4 2024 Update
It would be fair to say that the macroeconomic backdrop has changed in recent months. With the market pricing in a high probability of an outsized rate cut, the Fed decided it could be bold and deliver a 50 basis point (0.5 percentage points) move at its September meeting. This move reflected greater confidence that inflation is now in the rear-view mirror, and it is time for the Fed to switch its focus to maximising the chances of a soft landing. If delivered, the soft landing – our central scenario – would be positive for risk assets.
One note of caution is that while the Fed has embarked on a rate cutting cycle, policy is likely to remain restrictive for some time yet. Combined with the current cooling trend in the labour market, this means recession risk will remain elevated heading into 2025. Additional sources of risk, such as election uncertainty or geopolitical stress can also come into play. We therefore continue to expect a more volatile phase for investment markets.
At present, firms are hiring people at below normal pace, but layoffs are still low. Workers themselves are also voluntarily quitting jobs at a below normal rate. The net result of these depressed ‘gross’ labour market flows is that employment is still rising, but at a slower pace, which has resulted in a gradual rise in unemployment.
History, however, shows that in the US, a gradual rise in unemployment can suddenly flip into something more pernicious – recessions are non-linear events. Whether and precisely when the US economy experiences a recession is unclear, but the risk of a sharper downturn is now higher than anticipated a few months ago.
Many public equity markets are at or near record levels, with some market participants expecting this to lead to an increase in IPO activity – itself benefiting investors, with the return of capital increasing from relatively weak levels. Combined with the shifting macroeconomic environment, we believe that elevated equity markets should underpin activity within private equity markets, both in terms of valuations and rising deal activity.
Private capital fundraising – solid fundraising means a sizeable overhang persists
Fundraising across private capital markets has been solid, if unspectacular, during 2024. While the volume of capital raised is likely to break through the USD1.2tn barrier during 2024, when data is gathered post year-end, the number of funds closing has continued to fall. This continues the trend we have witnessed in recent years, as the largest managers closer ever-larger funds over longer fund series.
There appears to be little incentive or catalyst to change this trend, in our view. However, it belies the fact that there is still significant activity outside the mega-funds. Specialist managers across asset classes can target a niche within a market, focus on a particular sector, with real expertise or offer innovative strategies that would not be possible for bigger funds to execute.
Private capital fundraising: 2024 YTD compared to FY 2023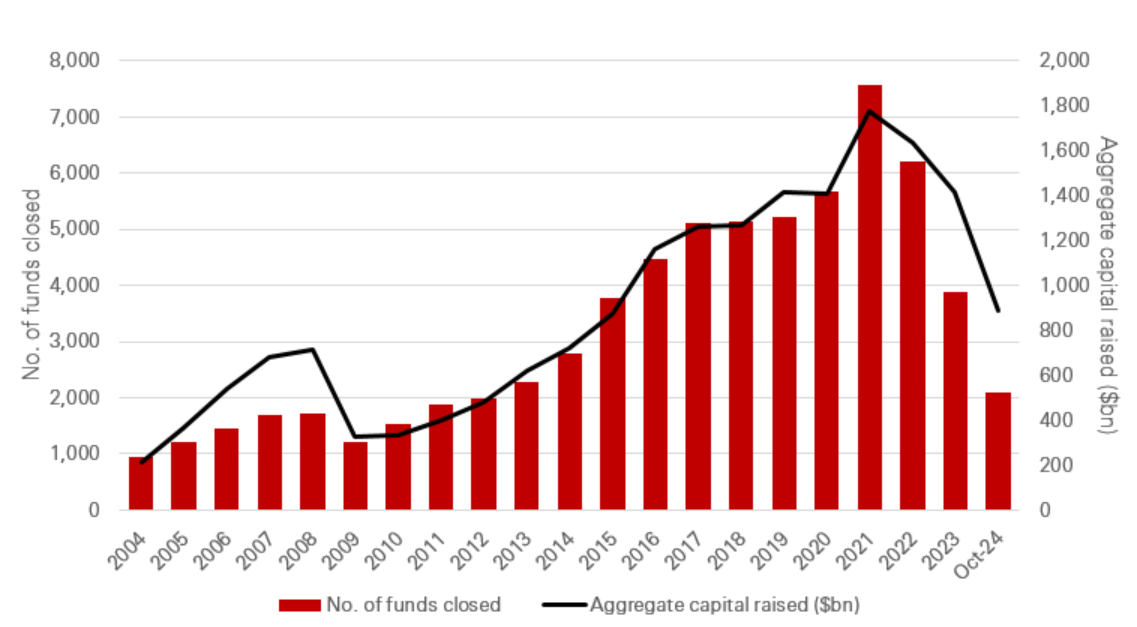
There is no guarantee that the trend illustrated by the chart above will continue Source: Preqin, data as of October 2024
One of the lasting effects of the USD1tn+ annual fundraising for private capital managers has been the accumulation of dry powder (capital committed by investors but not yet called). Collectively, managers have available dry powder of almost USD4tn to put to work. A natural question, given the large sums of capital available, is why haven’t managers put this to work? Asset selectivity is one of the potential reasons, with managers increasingly cautious when it comes to valuations and the underwriting of both acquisition and exit plans. Within the stock of dry powder, the bulk of the committed capital available was allocated from 2021 – this highlights the relative dearth of deal making since interest rates began to increase.
Private capital overhang by vintage year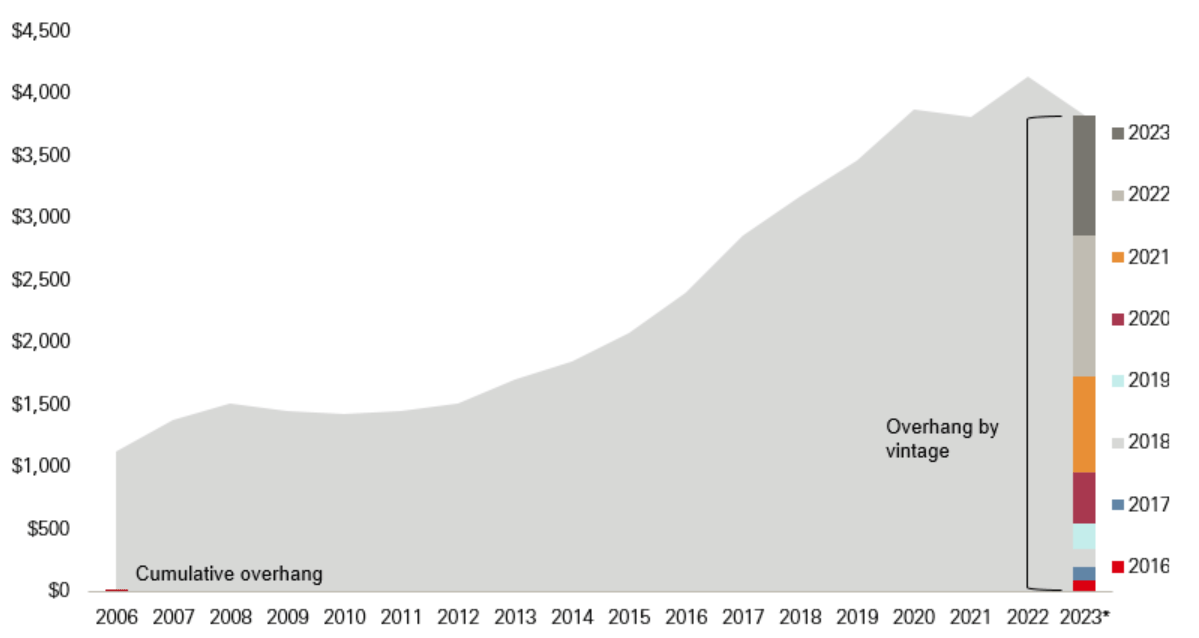
There is no guarantee that the trend illustrated by the chart above will continue Source: Pitchbook, data as of September 2024
Private equity: green shoots or a slow-burn
While private equity fundraising remains off its highs, the asset class still dominates the private capital landscape. Large buyout funds raised by managers with long-term and proven track records continue to receive disproportionate support from investors. Despite the dominance of large funds, there is an ecosystem across the lower and mid-market, which in our view is increasingly attractive to investors. This is primarily driven by what we would describe as reasonable valuations, solid company fundamentals and the potential for a wider range of future exit opportunities.
Private equity capital raised by size bucket ($bn)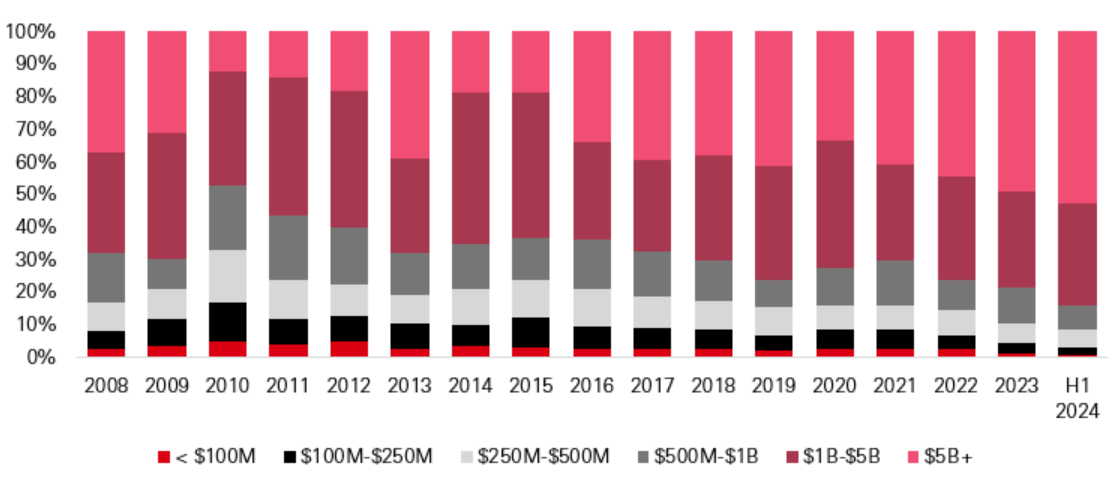
There is no guarantee that the trend illustrated by the chart above will continue Source: Pitchbook, data as of September 2024
PE first time fundraising activity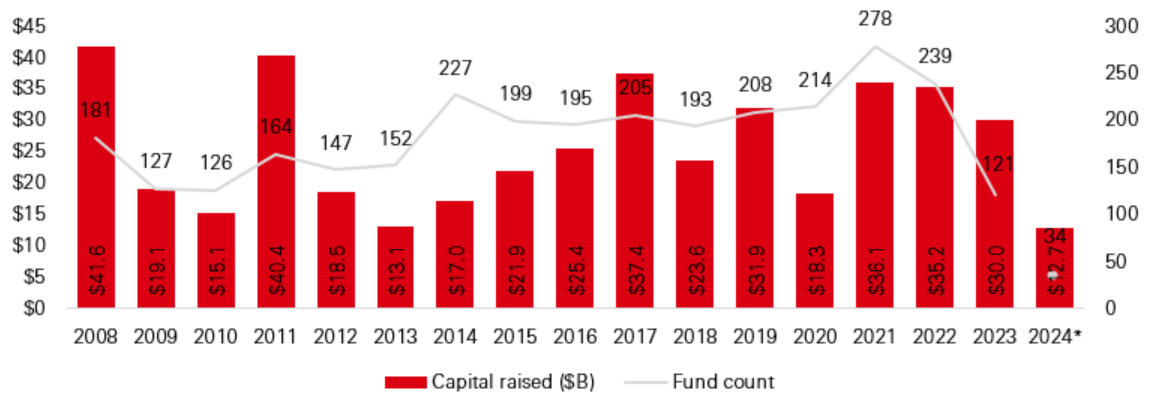
There is no guarantee that the trend illustrated by the chart above will continue Source: Pitchbook, data as of September 2024
During 2024, Europe-focused funds have seen their share of fundraising hit the highest level in several years – when measured as a proportion of total capital raised. This could be a reflection of the path of interest rates in Europe, which saw the ECB cut rates prior to the US Fed, while it may also be due to pricing in Europe, which has been more attractive than some other markets. Regardless, activity levels should pick up quite significantly in Europe during the latter part of 2024 and into 2025 as these allocations are put to work.
Private equity capital raised by region ($bn)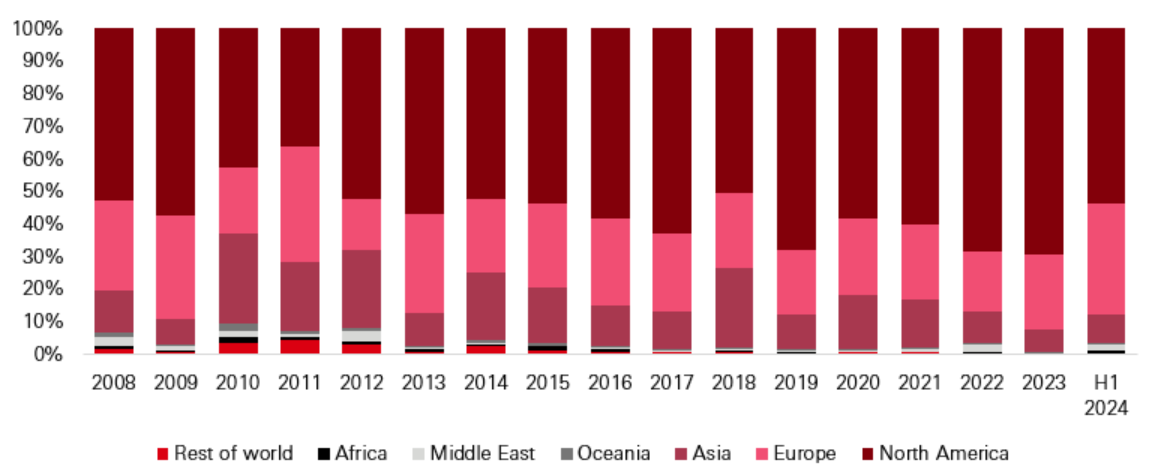
There is no guarantee that the trend illustrated by the chart above will continue Source: Pitchbook, data as of September 2024
Across global private equity markets, dry powder fell from record levels, which were reached in 2022. With around USD1.5tn of dry powder available, fund managers have significant resources for future investments. Despite the level of capital available, many fund managers are exercising caution when it comes to capital deployment and are seeking an attractive entry valuation, which would allow them to maintain historic return levels, rather than simply lower their own return targets.
Unsurprisingly, given the macroeconomic backdrop, many fund managers are cautiously optimistic about global economic growth. This is particularly true in the US, where many managers continue to monitor for pockets of weakness, which might present long-term opportunities. There are also several long-term, secular, trends playing out, with significant opportunities for private equity managers. These can be found in energy transition, on-shoring or near-shoring of supply chains and the emergence of AI. Each of these trends requires significant volumes of capital spending and with government balance sheets stretched, private equity will have a major role to play in either delivery or configuration of the tools that will enable real progress towards end goals.
Inflation is softening and interest rates are gradually coming down from recent peaks – although the exact timing and magnitude can be debated. The direction of travel is what is generally important to investors and fund managers alike. In an environment such as this, fund managers can be more confident in their assumptions and feel better able to make longer-term decisions on investments. They are also likely to be increasingly committed to closing transactions (both buying and selling) over the next 12 months, instead of holding out and waiting for a more stable environment and stronger market, as was the case in the last 12-24 months. This all bodes well for a future increase in activity.
Such an environment should benefit managers with strong value creation capabilities, which will shield them from the impact of interest rates that are still high (both in relative and absolute terms). Such an approach should also allow them to grow assets and achieve future exits without over-reliance on leverage and financial engineering to deliver returns.
Private credit – myth-busting
In recent months, there have been many headlines written about private credit – particularly around risks. We feel it is worth dispelling some of the common misconceptions. Defaults, or potential defaults, are frequently cited, given that some view the asset classes expansion as a source of risk. This argument suggests that credit quality has deteriorated as the asset class expanded – with pressure on managers to deploy rising volumes of committed capital. However, data suggests that defaults have remained relatively consistent since interest rates began to increase, averaging 2.5 per cent each quarter since the beginning of 2022, taking into account non-accruals and interest modifications . While concerns over private credit defaults are to be expected, we believe evidence suggests that these fears have been overplayed somewhat.
However, we remain vigilant. Higher borrowing costs are sometimes combining with other risks, which themselves have the potential to increase borrower stress. There has been an increase in the use of PIK (payment in kind) facilities, deferring interest payments for some firms struggling financially. These types of facilities can work well for both borrower and lender, and often form part of a wider strategy when it comes to underwriting loans. These facilities are not binary and can serve an important purpose. Overall, default and loss rates remain at low levels due to the senior secured nature of the loan instruments and the highly diversified exposure of the underlying portfolios.
A further concern among many market participants centers around potential reductions in demand while interest rates are falling. One explanation for continued solid demand and activity is that, while rates are on their way down, it is unlikely that they will get close to the very low levels experienced during the last decade. Should interest rates begin to normalise around the 2.5 per cent to 3.5 per cent level, that leaves significant room for private credit assets to deliver attractive all-in yield to investors – particularly when compared to fixed-rate bonds. The premiums available from private credit investments can deliver somewhat of a cushion, as floating-rate yields decline into the future.
Given this backdrop, it is interesting to see that investors have continued to commit to private credit funds. More than USD130bn has been allocated to private credit funds in the year to October 2024. While the capital consolidation trend evident in other asset classes is present in private credit markets too, this should not detract from the fact that investors remain positive towards the asset class.
Private credit fundraising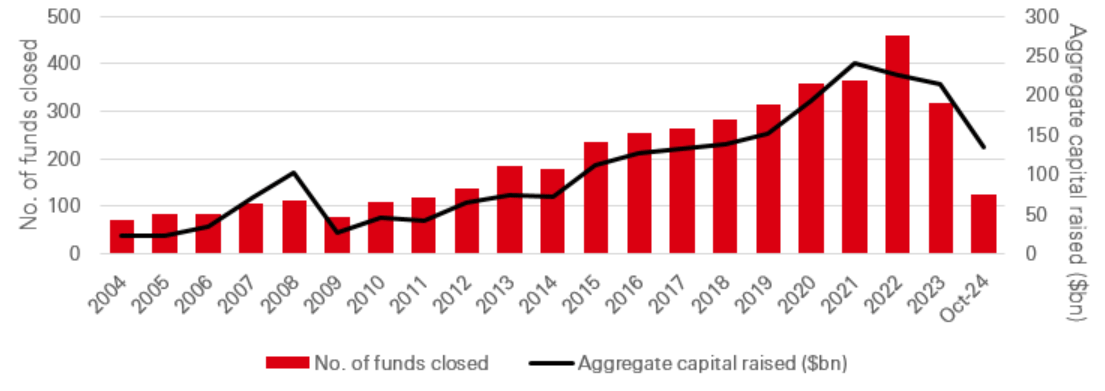
There is no guarantee that the trend illustrated by the chart above will continue Source: Preqin, data as of October 2024
All things considered, for some firms, the borrowing market is becoming more difficult. One potential consequence of this is a move towards longer loan / hold periods. For some, this could take the form of amend and extends or debt-to-equity swaps. Fund managers will likely consider these options in their own underwriting and could potentially seek to benefit from more distressed opportunities, or those where in-house expertise can benefit their borrowers. This is, of course, true for all private credit strategies, where relationships count and loans are often viewed as a partnership. This can be very important for borrowers.
Despite experiencing a significant increase, just 6 per cent of US corporate lending is accounted for by private credit. In our view, given the characteristics of the asset class, there remains considerable upside for future growth – particularly when considering that the US is arguably the most mature private credit market and penetrations is still low. There are a wide range of options available to private credit managers and with returns available across a myriad of opportunities, the asset class is likely to remain in demand for some time yet.
Private credit share of US corporate debt outstanding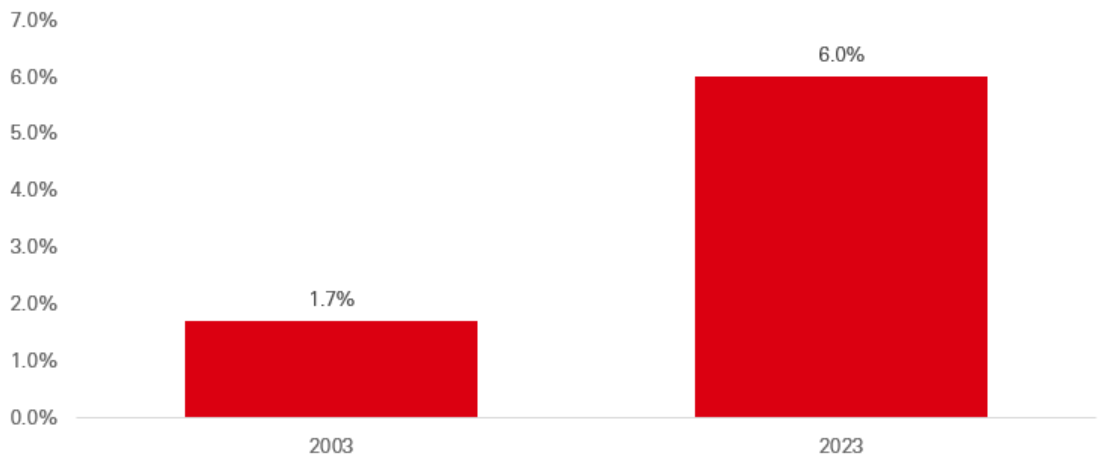
There is no guarantee that the trend illustrated by the chart above will continue. Source: Apollo, as of October 2024
Real estate – where is the future upside?
Property values have been adjusting to higher interest rates over the past two years. Value declines have been driven predominantly by yield expansion. Despite economic uncertainty, income has continued to grow. Capital values have been more stable in Asia-Pacific, which partly reflects low interest rates in Japan, and less of a spike in valuations in 2021/early 2022. Lower yielding sectors were initially most impacted by the impact of yield expansion. However, value declines are now more concentrated in the office sector, where operating fundamentals are more challenged.
Since interest rates began to increase, property valuations have suffered – given that real estate is yield-sensitive and is often priced in a similar way to bonds. With values hit during the recent period of higher inflation and interest rates, it is perhaps unsurprising that investor demand for real estate funds weakened. During 2022, real estate funds raised USD158.4bn. This fell to USD103.8bn in 2023 and dropped further to just USD29.5bn in the first half of 2024, according to Pitchbook data. So far in 2024 the rate of capital decline has moderated, and we anticipate values overall will stabilise during the second half of the year, although this will vary by sector and region. This provides an attractive entry point into the market, and prospective returns look more favourable than in previous years.
Real estate fundraising ($bn)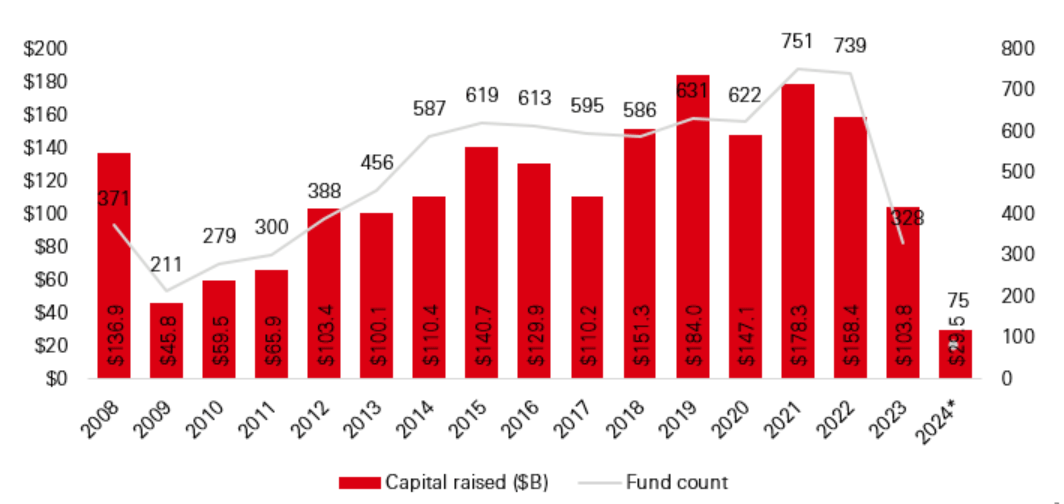
There is no guarantee that the trend illustrated by the chart above will continue. Source: Pitchbook, data to end H1 2024, as of September 2024
Listed real estate performance improved on an absolute and relative basis in Q3 2024. Rate cuts have started to come through, supported by weaker economic data, which has also translated into more interest in the asset class which has a number of defensive characteristics. The recent improvement in listed real estate market performance has made the overall sector more expensive relative to the direct market. However, Net Asset Values (NAVs) are likely to move higher, as the monetary policy backdrop has become more supportive for real estate. Private real estate capital markets are showing signs of reopening and we expect investment volumes to pick up during the second half of the year, with REITs well positioned to benefit from external growth opportunities that may exist.
Recent M&A deals in the listed real estate market also point to rising confidence. Some parts of the listed market are still trading at attractive discounts to the direct market despite having solid fundamentals. Dividend yields from global real estate equities stand at a premium to both wider equities and developed market government bonds. With the exception of the office sector, net-operating-income growth continues to be supported by solid demand and high occupancy levels, which should feed into future dividend growth, and provide a basis for healthy total returns.
MSCI US REIT Index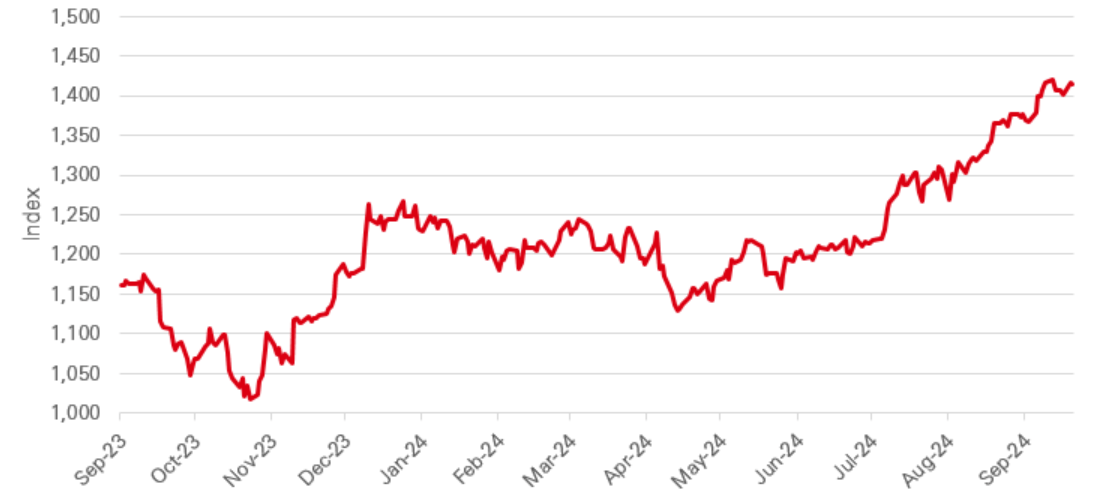
There is no guarantee that the trend illustrated by the chart above will continue. Source: Bloomberg, data as of September 2024
The office sector remains challenged by the combination of remote working and economic uncertainty reducing overing demand. Vacancy rates continued to rise in many of the key US and European office markets during the first half of 2024. However, prime rental growth remains evident, particularly in Europe for best-in-class properties, particularly those with solid green or energy efficiency standards, as tenant demand becomes more concentrated and focused.
Even though interest rates are now falling in some markets, they are not expected to reach previous low levels. As a result we would expect income and income growth to be the predominant drivers of total returns over the medium term.. We believe that the best placed sectors to deliver this in the short-to medium-term are those supported by structural tailwinds, such as e-commerce driven logistics real estate and non-traditional sectors such as senior housing and data centres. However, the caveat is that individual markets are subject to their own supply and demand fundamentals and stock specific factors.
Infrastructure – sweat the small stuff
Across the infrastructure asset class, 2024 has seen a recovery in fundraising – from admittedly low levels. In fact, capital raised in 2023 (USD94.2bn) was the lowest annual total since 2015 (USD82.9bn). Coming from such a low base, some increase was likely. As allocations have been solid, it is likely that 2024 commitments will outweigh those in 2023. This should mark the first annual fundraising increase in two years – hardly spectacular but positive nonetheless. However, with the number of funds closing still far from recent highs, consolidation has continued. Fundraising data for 2024 is based upon a fund’s final close date. Many funds have also made significant interim closes, which are therefore missed form the annual total. Brookfield and Copenhagen Infrastructure Partners could still close their own funds of over USD10bn in size before the end of the year. In addition, KKR’s Global Infrastructure Investors V may hold a final close, with an USD11bn first close already completed.
Among the reasons investors have been allocating towards infrastructure funds, the desire to capitalise on long-term secular trends has been a major factor in allocation decisions. These trends include what we would term the three “ds”: digitalisation, decarbonisation and deglobalisation – in no particular order.
Infrastructure fundraising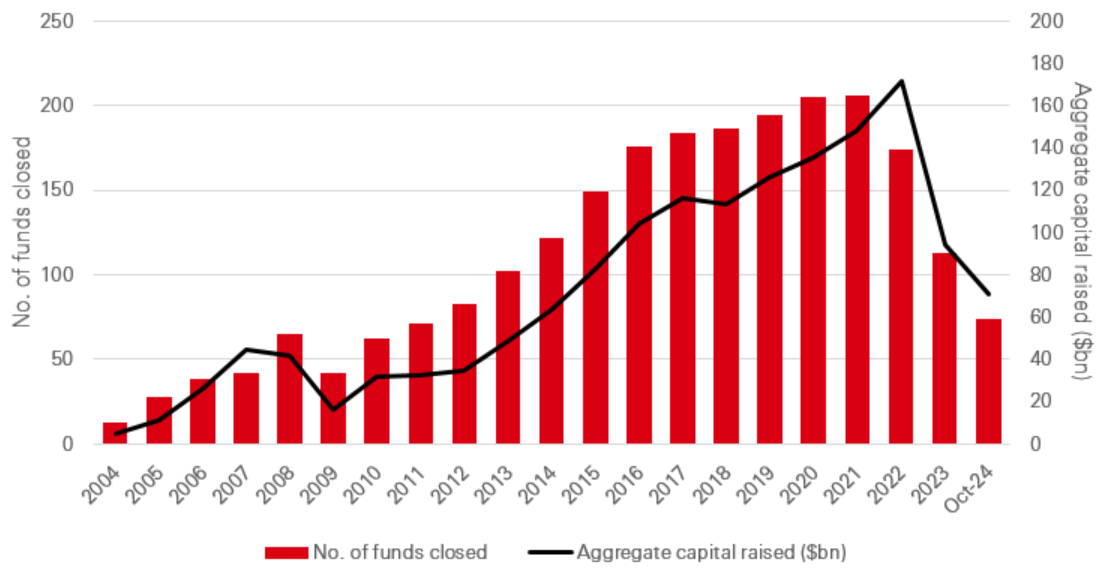
There is no guarantee that the trend illustrated by the chart above will continue. Source: Preqin, as of October 2024
Consolidation of capital is a theme we have discussed at length. However, it can lead investors to consider the structural impacts across the infrastructure asset class – informing future allocation decisions. Manager experience appears to be more important than ever, with emerging managers raising just 7.2 per cent of capital during the first half of the year across real assets funds, according to Pitchbook data. This is occurring as allocators are broadening their geographical exposure, having made increased commitments to funds targeting investments in Asia. Still, it is worth highlighting the scale of the challenge facing new or emerging infrastructure managers in this environment. In the first half of the year, new or emerging managers secured just USD3.2bn, potentially on track to be the lowest annual number since 2011 (USD9.6bn).
Real assets (infrastructure and natural resources) capital raised ($bn) by manager experience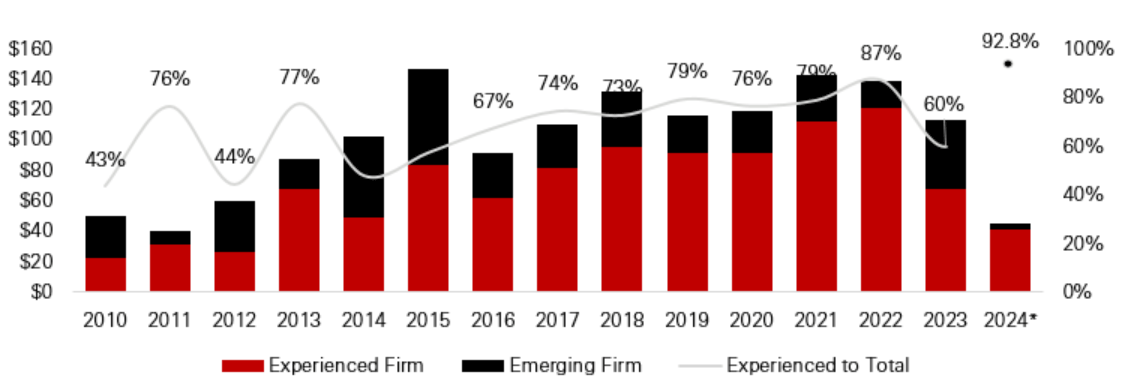
There is no guarantee that the trend illustrated by the chart above will continue Source: Pitchbook, *H1 2024 data, as of September 2024
This can raise a question around whether larger funds are the best place to allocate capital to. If investors simply focus on the top-end of the market, we believe that they would be missing a significant opportunity. In our view, with a prudent approach to manager selection and disciplined execution, mid-market funds can potentially outperform large-cap funds. One way in which to see the opportunity is to look at the assets that would form the investments of small or mid-market funds, compared to assets that might sit within large-scale funds. While a generalisation, we believe larger funds will invest in assets that are likely to be bigger, lower risk and potentially generating stable cash flows. This might put many assets within the Core ‘bucket’.
The bulk of infrastructure capital raising is focused on large-scale funds (>USD1bn in size): an average of 76 per cent of capital raised was secured by these funds between 2013 and the end of Q3 2023. This has created an environment of intense competition among large-scale funds for large-scale investment opportunities. As a result of this competition, entry valuations have been driven higher over time. A focus on the lower to mid-market allows assets to be bought at lower earnings multiples, with scope for a higher multiple upon exit, having scaled an infrastructure company up to a size attractive to the mega-funds. This trend flows through to performance.
When assessing performance data, we can see that mid-market assets have generated significant returns over the long-term, particularly when compared to Core assets and the broader index of assets. This backs-up the assumption that smaller assets can outperform their larger counterparts. In our view, while the performance highlighted is at the asset level, it is sensible to assume that the assets which would sit in mid-market or large-scale funds would comprise similar assets to those in the respective indices. This gives us some comfort in our preference towards mid-market assets.
Infrastructure returns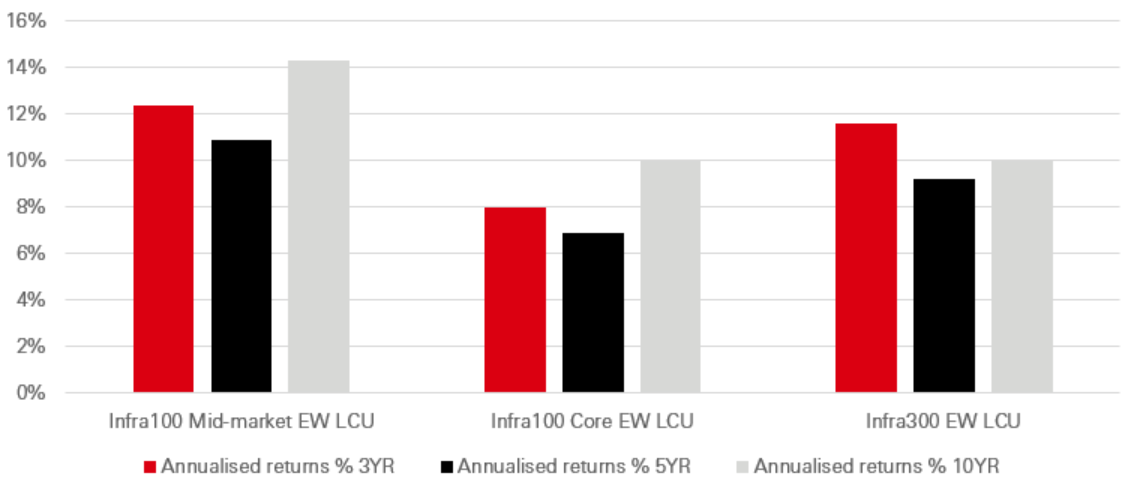
There is no guarantee that the trend illustrated by the chart above will continue Source: EDHEC, data as of July 2024
Size can often have a more significant effect in private markets than public markets. We believe this is particularly true in the infrastructure asset class. And within that, in our view, the infrastructure middle market offers a particularly interesting opportunity. While returns from mid-market assets are greater than Core assets over the long-term, we believe they also offer additional diversification benefits, through providing assess to parts of the market off-limits to those which invest only in larger funds.
We believe that future performance upside is likely to be boosted by strong investment growth trends in energy transition, decarbonisation and digitisation. Renewable energy and data centres in particular show solid growth potential, with long-term drivers of increased activity. These represent just two significant parts of the market, with others also a potential area of focus – leading to a range of options for investors.
Important Information
For Professional Clients and intermediaries within countries and territories set out below, and for Institutional Investors and Financial Advisors in the US. This document should not be distributed to or relied upon by Retail clients/investors.
The value of investments and the income from them can go down as well as up and investors may not get back the amount originally invested. The performance figures contained in this document relate to past performance, which should not be seen as an indication of future returns. Future returns will depend, inter alia, on market conditions, investment manager’s skill, risk level and fees. Where overseas investments are held the rate of currency exchange may cause the value of such investments to go down as well as up. Investments in emerging markets are by their nature higher risk and potentially more volatile than those inherent in some established markets. Economies in Emerging Markets generally are heavily dependent upon international trade and, accordingly, have been and may continue to be affected adversely by trade barriers, exchange controls, managed adjustments in relative currency values and other protectionist measures imposed or negotiated by the countries and territories with which they trade. These economies also have been and may continue to be affected adversely by economic conditions in the countries and territories in which they trade.
The contents of this document may not be reproduced or further distributed to any person or entity, whether in whole or in part, for any purpose. All non-authorised reproduction or use of this document will be the responsibility of the user and may lead to legal proceedings. The material contained in this document is for general information purposes only and does not constitute advice or a recommendation to buy or sell investments. Some of the statements contained in this document may be considered forward looking statements which provide current expectations or forecasts of future events. Such forward looking statements are not guarantees of future performance or events and involve risks and uncertainties. Actual results may differ materially from those described in such forward-looking statements as a result of various factors. We do not undertake any obligation to update the forward-looking statements contained herein, or to update the reasons why actual results could differ from those projected in the forward-looking statements. This document has no contractual value and is not by any means intended as a solicitation, nor a recommendation for the purchase or sale of any financial instrument in any jurisdiction in which such an offer is not lawful. The views and opinions expressed herein are those of HSBC Asset Management at the time of preparation and are subject to change at any time. These views may not necessarily indicate current portfolios' composition. Individual portfolios managed by HSBC Asset Management primarily reflect individual clients' objectives, risk preferences, time horizon, and market liquidity. Foreign and emerging markets. Investments in foreign markets involve risks such as currency rate fluctuations, potential differences in accounting and taxation policies, as well as possible political, economic, and market risks. These risks are heightened for investments in emerging markets which are also subject to greater illiquidity and volatility than developed foreign markets. This commentary is for information purposes only. It is a marketing communication and does not constitute investment advice or a recommendation to any reader of this content to buy or sell investments nor should it be regarded as investment research. It has not been prepared in accordance with legal requirements designed to promote the independence of investment research and is not subject to any prohibition on dealing ahead of its dissemination. This document is not contractually binding nor are we required to provide this to you by any legislative provision.
All data from HSBC Asset Management unless otherwise specified. Any third-party information has been obtained from sources we believe to be reliable, but which we have not independently verified.
HSBC Asset Management is the brand name for the asset management business of HSBC Group, which includes the investment activities that may be provided through our local regulated entities. HSBC Asset Management is a group of companies in many countries and territories throughout the world that are engaged in investment advisory and fund management activities, which are ultimately owned by HSBC Holdings Plc. (HSBC Group). The above communication is distributed by the following entities:
- In Argentina by HSBC Global Asset Management Argentina S.A., Sociedad Gerente de Fondos Comunes de Inversión, Agente de administración de productos de inversión colectiva de FCI N°1;
- In Australia, this document is issued by HSBC Bank Australia Limited ABN 48 006 434 162, AFSL 232595, for HSBC Global Asset Management (Hong Kong) Limited ARBN 132 834 149 and HSBC Global Asset Management (UK) Limited ARBN 633 929 718. This document is for institutional investors only and is not available for distribution to retail clients (as defined under the Corporations Act). HSBC Global Asset Management (Hong Kong) Limited and HSBC Global Asset Management (UK) Limited are exempt from the requirement to hold an Australian financial services license under the Corporations Act in respect of the financial services they provide. HSBC Global Asset Management (Hong Kong) Limited is regulated by the Securities and Futures Commission of Hong Kong under the Hong Kong laws, which differ from Australian laws. HSBC Global Asset Management (UK) Limited is regulated by the Financial Conduct Authority of the United Kingdom and, for the avoidance of doubt, includes the Financial Services Authority of the United Kingdom as it was previously known before 1 April 2013, under the laws of the United Kingdom, which differ from Australian laws;
- in Bermuda by HSBC Global Asset Management (Bermuda) Limited, of 37 Front Street, Hamilton, Bermuda which is licensed to conduct investment business by the Bermuda Monetary Authority;
- in Chile: Operations by HSBC's headquarters or other offices of this bank located abroad are not subject to Chilean inspections or regulations and are not covered by warranty of the Chilean state. Further information may be obtained about the state guarantee to deposits at your bank or on www.sbif.cl;
- in Colombia: HSBC Bank USA NA has an authorized representative by the Superintendencia Financiera de Colombia (SFC) whereby its activities conform to the General Legal Financial System. SFC has not reviewed the information provided to the investor. This document is for the exclusive use of institutional investors in Colombia and is not for public distribution;
- in Finland, Norway, Denmark and Sweden by HSBC Global Asset Management (France), a Portfolio Management Company authorised by the French regulatory authority AMF (no. GP99026) and through the Stockholm branch of HSBC Global Asset Management (France), regulated by the Swedish Financial Supervisory Authority (Finansinspektionen);
- in France, Belgium, Netherlands, Luxembourg, Portugal, Greece by HSBC Global Asset Management (France), a Portfolio Management Company authorised by the French regulatory authority AMF (no. GP99026);
- in Germany by HSBC Global Asset Management (Deutschland) GmbH which is regulated by BaFin (German clients) respective by the Austrian Financial Market Supervision FMA (Austrian clients);
- in Hong Kong by HSBC Global Asset Management (Hong Kong) Limited, which is regulated by the Securities and Futures Commission. This video/content has not be reviewed by the Securities and Futures Commission;
- in India by HSBC Asset Management (India) Pvt Ltd. which is regulated by the Securities and Exchange Board of India;
- in Italy and Spain by HSBC Global Asset Management (France), a Portfolio Management Company authorised by the French regulatory authority AMF (no. GP99026) and through the Italian and Spanish branches of HSBC Global Asset Management (France), regulated respectively by Banca d’Italia and Commissione Nazionale per le Società e la Borsa (Consob) in Italy, and the Comisión Nacional del Mercado de Valores (CNMV) in Spain;
- in Malta by HSBC Global Asset Management (Malta) Limited which is regulated and licensed to conduct Investment Services by the Malta Financial Services Authority under the Investment Services Act;
- in Mexico by HSBC Global Asset Management (Mexico), SA de CV, Sociedad Operadora de Fondos de Inversión, Grupo Financiero HSBC which is regulated by Comisión Nacional Bancaria y de Valores;
- in the United Arab Emirates, Qatar, Bahrain & Kuwait by HSBC Global Asset Management MENA, a unit within HSBC Bank Middle East Limited, U.A.E Branch, PO Box 66 Dubai, UAE, regulated by the Central Bank of the U.A.E. and the Securities and Commodities Authority in the UAE under SCA license number 602004 for the purpose of this promotion and lead regulated by the Dubai Financial Services Authority. HSBC Bank Middle East Limited is a member of the HSBC Group and HSBC Global Asset Management MENA are marketing the relevant product only in a sub-distributing capacity on a principal-to-principal basis. HSBC Global Asset Management MENA may not be licensed under the laws of the recipient’s country of residence and therefore may not be subject to supervision of the local regulator in the recipient’s country of residence. One of more of the products and services of the manufacturer may not have been approved by or registered with the local regulator and the assets may be booked outside of the recipient’s country of residence.
- in Peru: HSBC Bank USA NA has an authorized representative by the Superintendencia de Banca y Seguros in Perú whereby its activities conform to the General Legal Financial System - Law No. 26702. Funds have not been registered before the Superintendencia del Mercado de Valores (SMV) and are being placed by means of a private offer. SMV has not reviewed the information provided to the investor. This document is for the exclusive use of institutional investors in Perú and is not for public distribution;
- in Singapore by HSBC Global Asset Management (Singapore) Limited, which is regulated by the Monetary Authority of Singapore. The content in the document/video has not been reviewed by the Monetary Authority of Singapore;
- in Switzerland by HSBC Global Asset Management (Switzerland) AG. This document is intended for professional investor use only. For opting in and opting out according to FinSA, please refer to our website; if you wish to change your client categorization, please inform us. HSBC Global Asset Management (Switzerland) AG having its registered office at Gartenstrasse 26, PO Box, CH-8002 Zurich has a licence as an asset manager of collective investment schemes and as a representative of foreign collective investment schemes. Disputes regarding legal claims between the Client and HSBC Global Asset Management (Switzerland) AG can be settled by an ombudsman in mediation proceedings. HSBC Global Asset Management (Switzerland) AG is affiliated to the ombudsman FINOS having its registered address at Talstrasse 20, 8001 Zurich. There are general risks associated with financial instruments, please refer to the Swiss Banking Association (“SBA”) Brochure “Risks Involved in Trading in Financial Instruments”;
- in Taiwan by HSBC Global Asset Management (Taiwan) Limited which is regulated by the Financial Supervisory Commission R.O.C. (Taiwan);
- in the UK by HSBC Global Asset Management (UK) Limited, which is authorised and regulated by the Financial Conduct Authority;
- and in the US by HSBC Global Asset Management (USA) Inc. which is an investment adviser registered with the US Securities and Exchange Commission.
- In Uruguay, operations by HSBC's headquarters or other offices of this bank located abroad are not subject to Uruguayan inspections or regulations and are not covered by warranty of the Uruguayan state. Further information may be obtained about the state guarantee to deposits at your bank or on www.bcu.gub.uy.
NOT FDIC INSURED ◆ NO BANK GUARANTEE ◆ MAY LOSE VALUE
Copyright © HSBC Global Asset Management Limited 2024. All rights reserved. No part of this publication may be reproduced, stored in a retrieval system, or transmitted, on any form or by any means, electronic, mechanical, photocopying, recording, or otherwise, without the prior written permission of HSBC Global Asset Management Limited.


