
The impact of climate change on long-term asset allocation
The impact of climate change on long-term asset allocation
This article is a summary version of a more extensive analysis published in The Journal of Portfolio Management, which we are proud to say reflects the depth of research being conducted within our multi-asset platform and applied to the portfolios we manage.
Key highlights
The impact of climate change on economies is a key concern for long-term investors. We examine climate change as a macro phenomenon by nature, expected to exert influence on multiple asset classes at a global level. Focusing on the relationship between asset prices and macro variables, such as GDP growth and inflation, we consider how climate change may affect those variables in the future. In this research, we have sought to quantify the potential impact for multi-asset investors via their main portfolio building blocks.
A top down, forward-looking approach
The majority of academic studies linking investment decisions and ESG considerations have been performed at a granular scale, comparing the impact of sustainability at a corporate entity level. Climate change is however a macro phenomenon by nature, expected to have impact at a global level across multiple asset classes.
What’s more, climate change is expected to play a larger role in financial outcomes going forward, whereas there is limited evidence of a strong relationship looking back at history. This exacts a change in the way we can link the two topics: it is not enough to simply look back in time at the correlation between climate change and asset prices and expect this to be a reliable guide to future outcomes. The potential for climate ‘tipping points’ indicates a more nuanced approach is needed for climate studies in the context of portfolio outcomes.
To avoid this critique, we focus instead on the relationship between asset price risks and macro variables such as GDP growth and inflation, before considering how climate change may impact those variables in the future. The inter-linkage between macro fundamentals and asset prices is likely to be a repeatable process, and one for which we have extensive long run data to investigate relationships.
Figure 1: Schematic of the approach
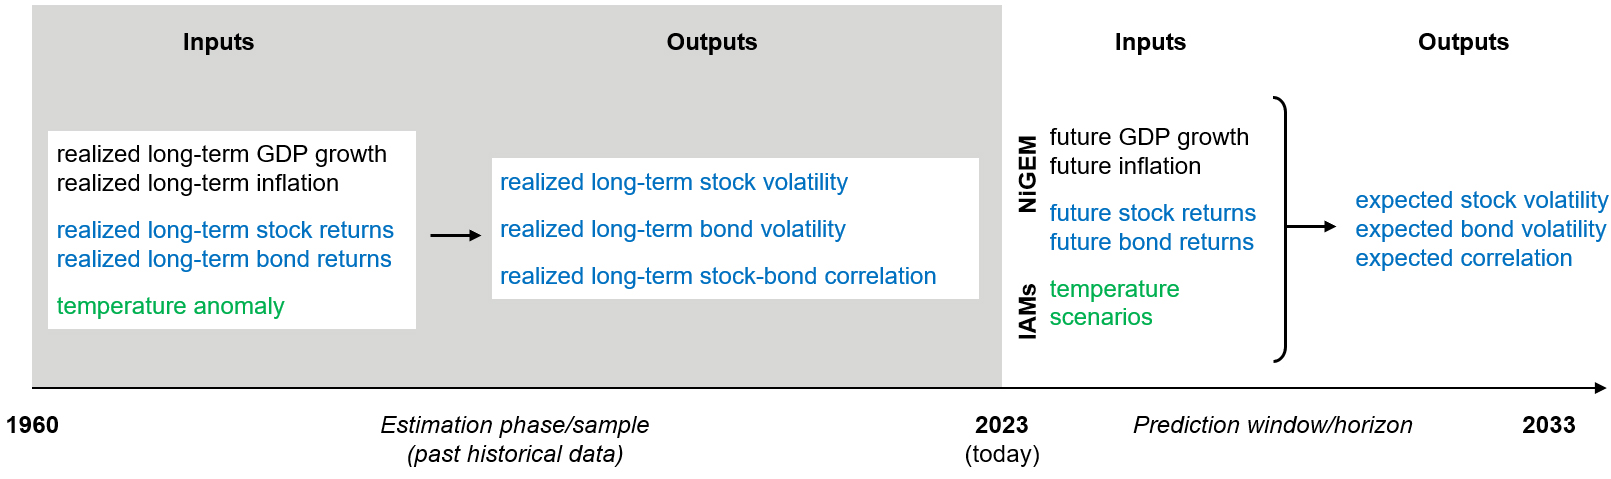
Source: HSBC Asset Management, June 2024.
The views expressed above were held at the time of preparation and are subject to change without notice. Any forecast, projection or target where provided is indicative only and not guaranteed in any way. HSBC Asset Management accepts no liability for any failure to meet such forecast, projection or target.
Key portfolio building blocks
Our study concentrates on the three major components of risk to a typical multi-asset portfolio:
- Equity volatility
- Bond volatility
- Equity-bond correlation
We relate these variables to macro variables by a series of regressions, preferring the simplicity and transparency of the approach to alternative specifications such as vector autoregressive models or theoretical asset pricing models. The charts below show the regression coefficients from selected models.
Figure 2: Regressions coefficients
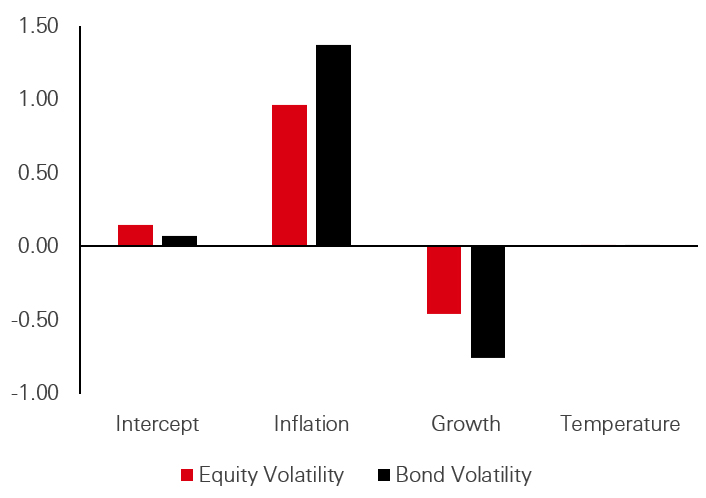
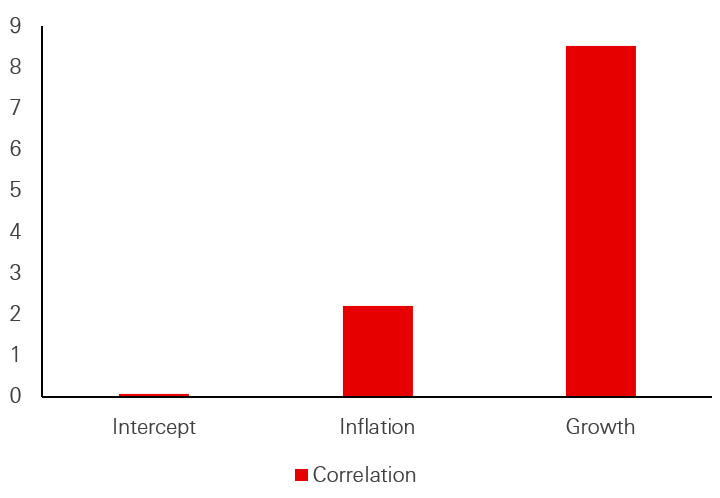
Past performance is no guarantee of future returns. Source: HSBC AM, February 2024.
Although the size of coefficients does not tell a full picture, each variable is significant at a 1 per cent level with adjusted model R2’s above 0.6.
We can see that a rise in inflation increases asset price risk, whilst the same is true of declining growth rates. An increase in temperature has historically had a positive link to risk, however as mentioned earlier this is not the primary channel for climate change impact within the framework.
Equity-bond correlation has been seen to have a positive link to inflation and growth, the former relationship having strong academic support and being visible in the post-covid market experience.
Forward-looking predictions
Having established relationships between macro and portfolio variables, we can use forward-looking, ‘climate aware’ projections for macro variables to see what impact these have on risk estimates. To do this, we leverage Phase 3 outputs from the National Institute Global Econometric Model (NiGEM) – a large scale economic model which produces climate-based estimates for growth and inflation under a variety of climate models, scenarios and severities developed by the Network for Greening the Financial System (NGFS). These are complimented with temperature scenarios from the International Panel on Climate Change (IPCC). The figure below shows a sample of these outputs for GDP growth under various scenarios relative to a baseline scenario. The figures are shown as a percentage adjustment, meaning a -10 per cent adjustment to a baseline of 2.2 per cent results in a 2 per cent growth outcome.
Figure 3: Climate adjustment for US GDP Growth
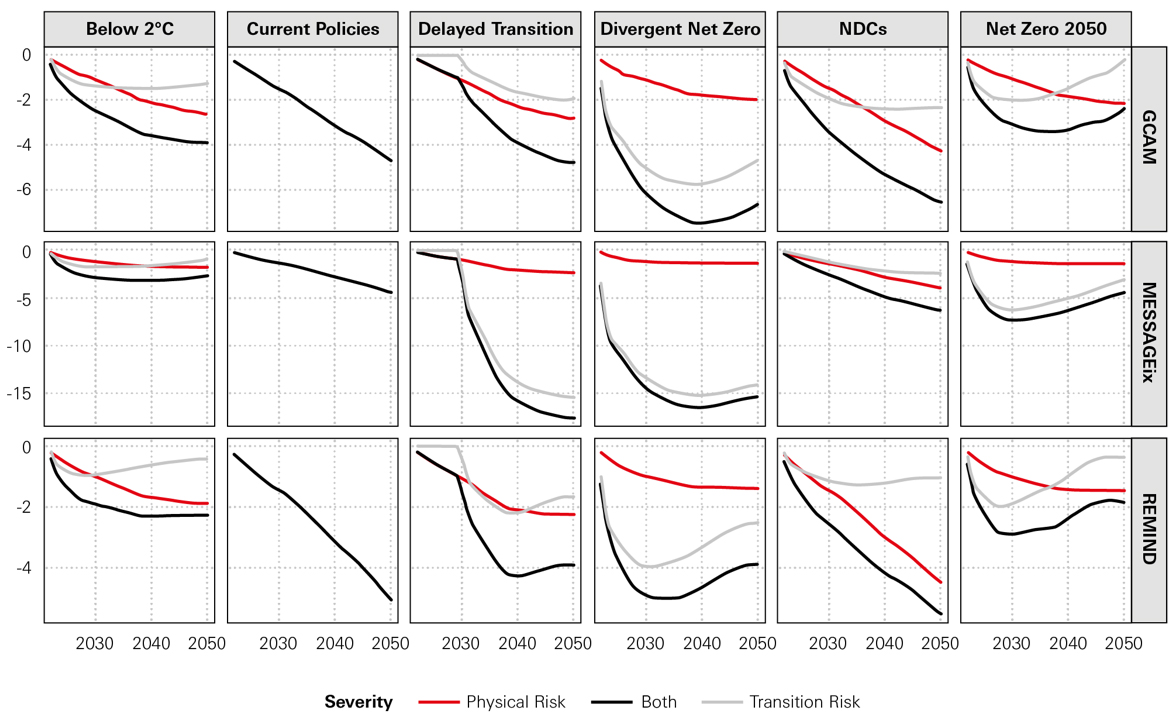
Source: HSBC Asset Management, February 2024. Notes: We plot the time-series of correction for GDP growth implied by climate models, scenarios, and severities compared with the baseline situation (in per cent). The values are in percentages of adjustment to the baseline growth value. For the period 2023–2033, it is equal to +2.2 per cent.
Armed with these scenarios and the results of our modelling, we can plot a distribution of outcomes for our variables of interest. We deploy a shrinkage between prior historical values and our new estimates to produce a distribution of future outcomes.
In the upper panels of figure 3, we illustrate the difference between past realized and future predicted volatility. For equities, historical volatility has ranged from 11 per cent to 17 per cent with an average of 14.5 per cent, whereas our forecasts lie mostly between 14 per cent and 15 per cent, with thin tails around 18 per cent. Similar conclusions hold for bonds as well.
One important takeaway from these figures is that both asset classes see a very similar pattern in the shift of their risk; a minority of scenarios predict lower volatility, whilst the majority of them indicate marginally larger risks. A very small proportion of cases imply much larger risks.
In the lower panels of the same figure, we show the distribution of predicted volatility, but conditional on the severity of climate scenarios. As the severity increases from baseline to combined (physical plus transition risk), the distribution slowly shifts to the right and the average risk increases, as one would expect.
Figure 4: Long-term volatility prediction
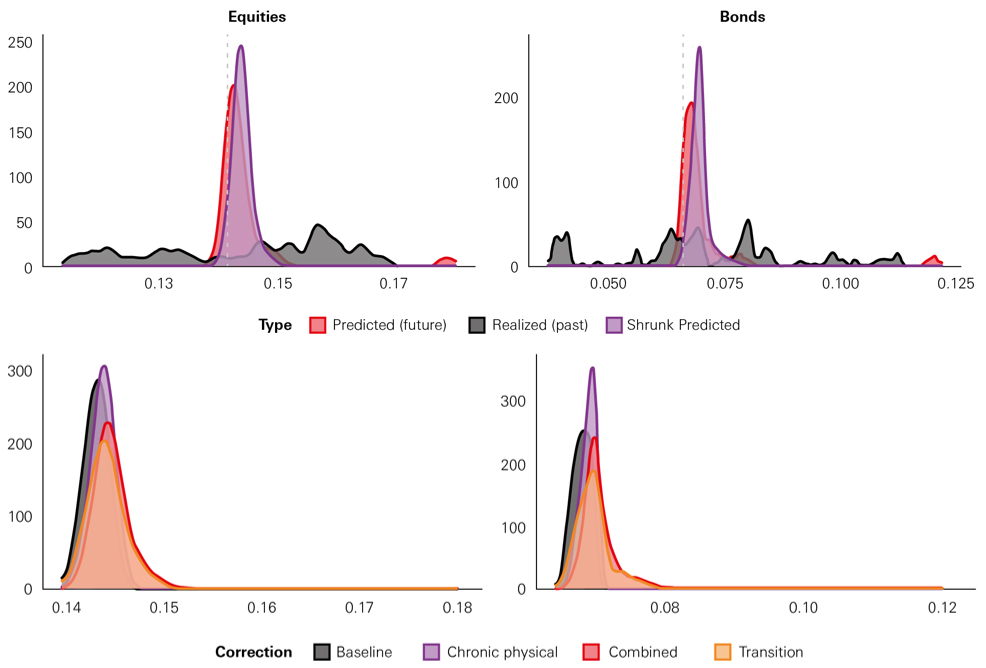
Source: HSBC Asset Management, February 2024.
Portfolio implications
One of the main objectives of the paper is to examine the impact of these climate aware variables on portfolio asset allocations. To do this, we start from a baseline 60 per cent equity 40 per cent bond portfolio and examine how the portfolio allocation shifts in light of this new climate awareness.
Figure 5: Climate-based adjustment to the 60/40 allocation, without long-term returns
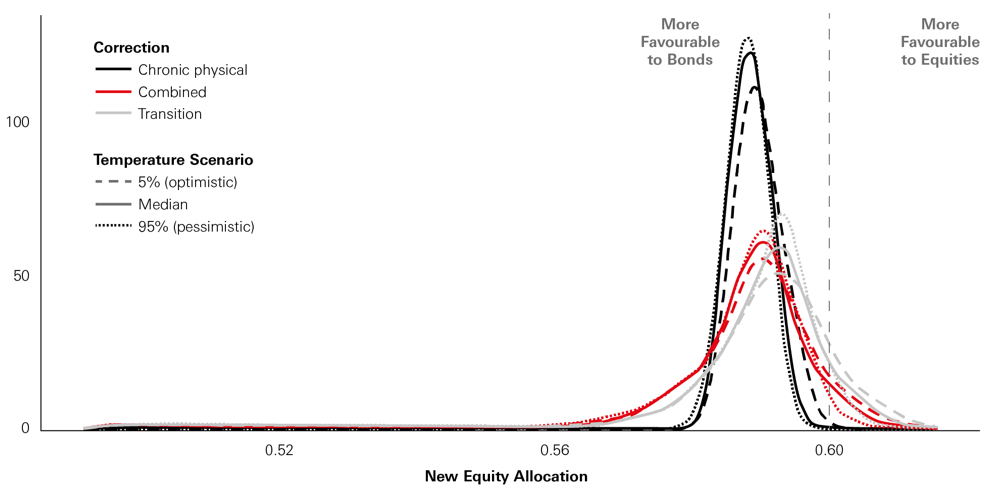
Source: HSBC Asset Management, February 2024.
We can see that given updates to a portfolio’s risk model, the asset allocations shifts to a more ‘defensive’ stance, with bonds favoured over equities. This is due to the increase in risk anticipated by climate concerns. Finally, we extend the framework to introduce returns which are impacted by climate (generated by the National Institute Global Econometric Model) and compare the Sharpe ratios of portfolios before and after adjustment.
Figure 6: Projected risk-adjusted performance
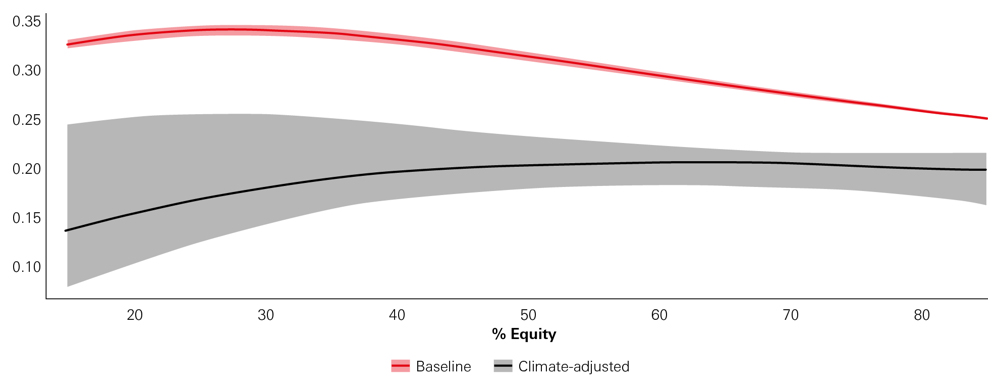
Source: HSBC Asset Management, February 2024. For expected returns, to remain consistent with climate-driven estimates, we pursue an exercise that takes as inputs the long-term returns generated by the NiGEM model (Phase 3). This is an arbitrary choice and serves only as illustration of the flexibility of our approach. We do not attest to their predictive power or accuracy, which is outside the scope of this article.
Here, we can see a clear deterioration in portfolio properties once the capital market assumptions embed a degree of climate awareness. This is the prospective challenge for asset allocators; in efficient frontier terms, most portfolios are likely to see a shift down (lower returns) and to the right (higher risk) in the face of climate concerns.
Conclusion
The impact of climate change on financial outcomes is a key concern for long term investors. In this research, we have sought to quantify the potential impact for multi-asset investors via their main portfolio building blocks. We can see that although in the majority of cases, individual variables themselves may not be too heavily impacted, there are still larger outliers in the case of severe events. Furthermore, combining these variables into a wider portfolio allocation shows that effects can compound, leading to lower prospective risk-adjusted returns and an optimal portfolio position which is more defensive.


