The Rise of the Laptop Lugger
COVID-19 induced lockdowns inspired a series of bleak predictions about the future of air travel. Though in the rear-view mirror this may look like a blip, such an oversimplification masks a series of new and uncertain trends.
The recent 100% recovery of global air traffic provides a good prompt to take stock of the cyclical and structural trends now driving aviation – from winding down pandemic-era excess savings, to the changing nature of leisure travel.
Exhibit 1: Aviation has recovered from its most severe downturn
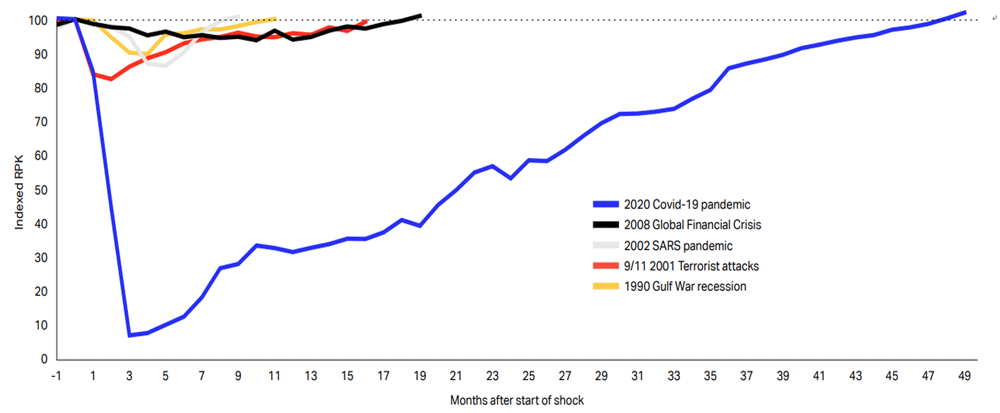
Note: RPK = Revenue Passenger Kilometres – a measure of volume of passengers moved in aircraft
Source: IATA Sustainability and Economics, IATA Monthly Statistics, iata.org/en/iata-repository/publications/economic-reports/global-outlook-for-air-transport-june-2024-report/
This review evaluates and updates important forward-looking considerations for investing in the transportation sector, particularly airports, which are an integral part of the infrastructure asset class.
While we foresee some additional complexities for the industry (greater seasonality, higher capillarity), the broad outlook for demand growth remains robust, underpinning the key attractions for exposure to an industry with GDP+ growth potential.
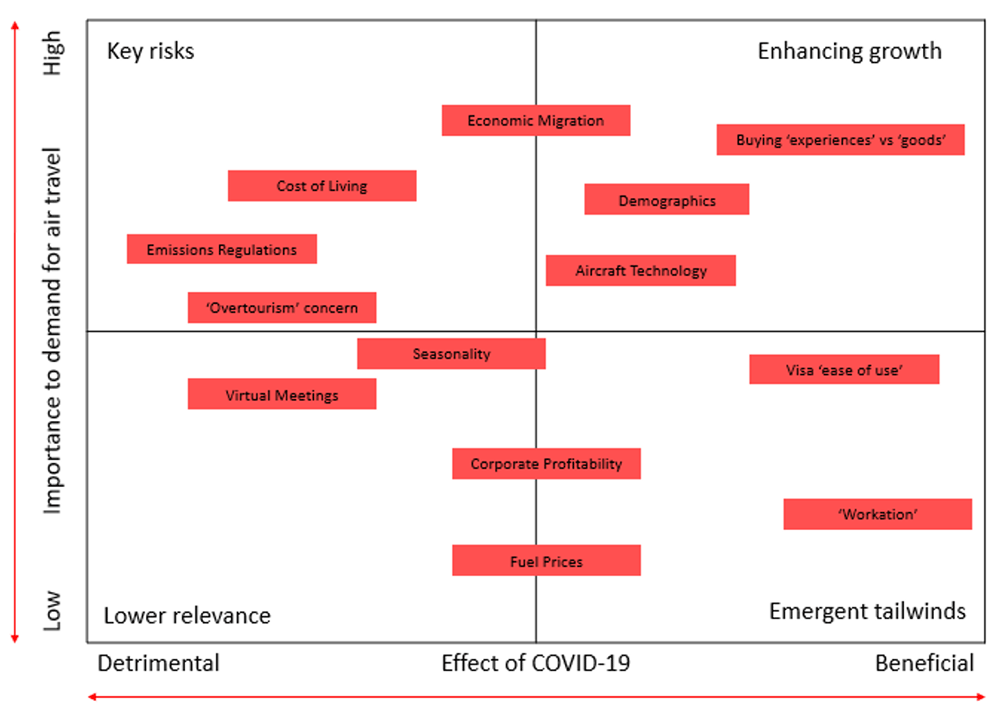
Exhibit 2: Mapping COVID impacts into long term potential
Source: HSBC AM
Why we travel – traditional segmentation
The most intuitive way to understand air travel is, in our view, the ‘why’.
Leisure – those who are travelling to explore, gain new experiences, use vacation time with family, or emulate social media travel trends. Traditionally more value-oriented, these travellers think about travel as part of the total cost of a vacation.
Business – moving between countries for professional purposes – either to visit intra-company facilities, or on client business. Compared to overall employment trends, business travel is overindexed to knowledge intensive industries (banking, consulting, tech) – i.e. those where earnings power is high, client contact is valued and corporations tend to be global.
Visiting Friends and Relatives (VFR) – travel in this category is more attuned to family and connectedness. Economic migration and overseas education are two key reasons why family and friends spread around the globe, but the need to stay connected supports repeated trips between locations.
While the proportions of travellers in each grouping will differ from route-to-route, country-to-country, and region-to-region, these proportions range from 40-50% for Leisure, 15-25% for Business and from 25-35% for VFR.
What drives growth in aviation?
The traditional model for demand growth in air travel is a linkage between GDP/capita and propensity to travel. This follows a logarithmic, rather than linear scale.
There are several very populous and fast-growing nations at the ‘rapid growth’ end of the scale, while developed markets tend to be in the more wealth-inelastic part of the curve.
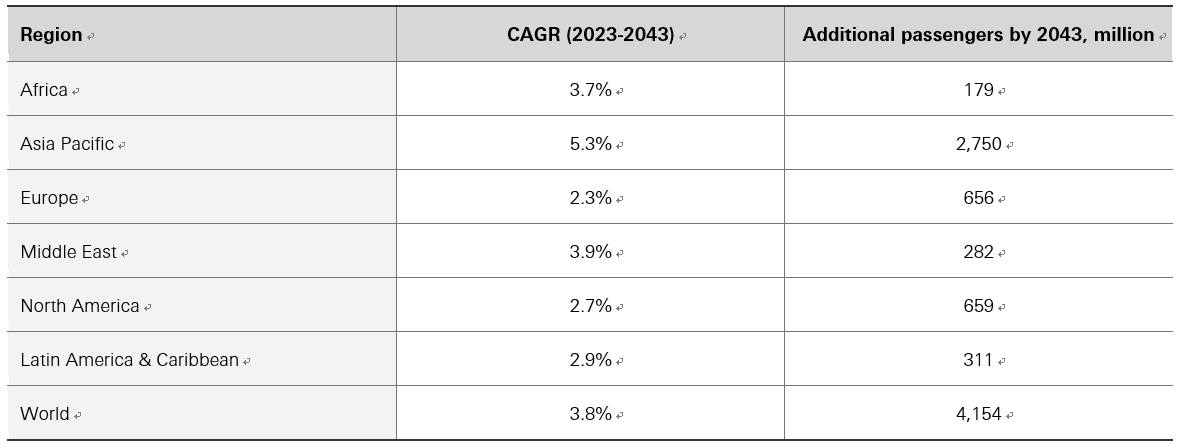
These developing nations are a key source of growth for global aviation – with industry body IATA forecasting them to contribute around 85% of the industry’s growth in the next 20 years.
Exhibit 3: Asia Pacific is expected to be the powerhouse of aviation demand growth
Source: Air Passenger Forecasts, February 2024 update, iata.org/en/iata-repository/publications/economic-reports/global-outlook-for-air-transport-june-2024-report/
In the short run, there are supply-side dynamics that augment the pure demand-led trend. As air travel is notoriously price elastic in the short-run, airlines which are able to compete on cost can grow the overall market. The penetration of Low Cost Carriers (LCCs) has been highly successful in North America and Europe (at around 1/3 of all flights), while the model is still relatively nascent in Latin America, Middle East, Asia Pacific and Africa (in the range of 0-20%).
While we expect continued growth in the LCC share in North America and Europe to have a modest stimulative effect on demand, the boost in developing markets is likely to be significant. Considering that the (real) price of air travel has fallen in an almost unbroken trend since the 1950s, the contribution of LCCs in the next 20 years will, in our view, continue to be highly relevant.
The ability of airports to capture this trend will mostly be determined by location. In general, airports in Asia Pacific are likely to display the highest growth rates vs. the global peer group, although we expect airports located close to prestigious cultural attractions to share in this above average growth regardless of region.
New trends spurred by COVID-19
There were some highly conspicuous effects of COVID-19 on aviation activity – the effect of border closures needs little explanation, for example. However, beyond the immediate impacts, the pause and subsequent recovery phases have spurred a number of new trends.
Erosion of excess savings
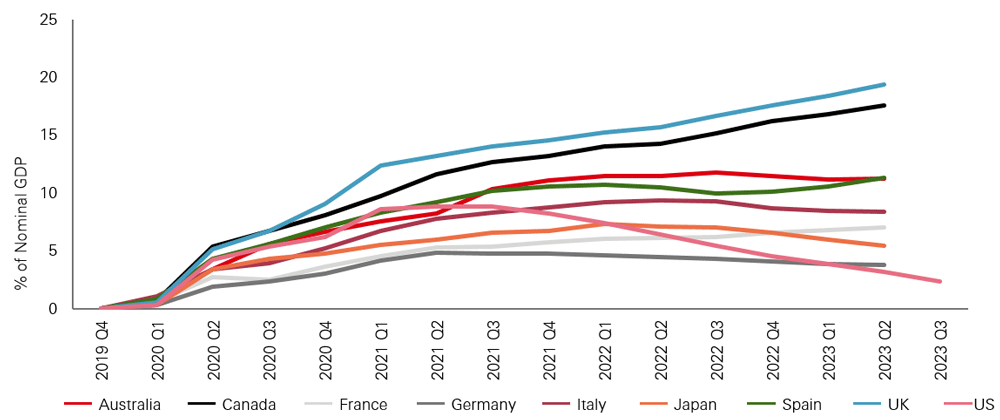
For many, lockdowns were an opportunity to accumulate extraordinary levels of excess savings. The reopening of borders proved a timely opportunity to spend these savings. The phenomenon of ‘revenge travel’ has been discussed extensively, but the status of these savings balances is now a key debate point in the tourism value chain. The subsequent exhibits suggest a mixed picture for pent-up demand, with excess savings in the USA nearly depleted (Exhibit 4), but European consumers retaining more potential to spend (with personal savings rates increasing in spite of the effects of inflation on day-to-day living expenses).
Exhibit 4: Cumulative excess savings still supportive in Europe, USA more mixed
Source: The Fed - An update on Excess Savings in Selected Advanced Economies (federalreserve.gov)
Exhibit 5: EU household savings rates well above trend, even as cost of living has risen strongly
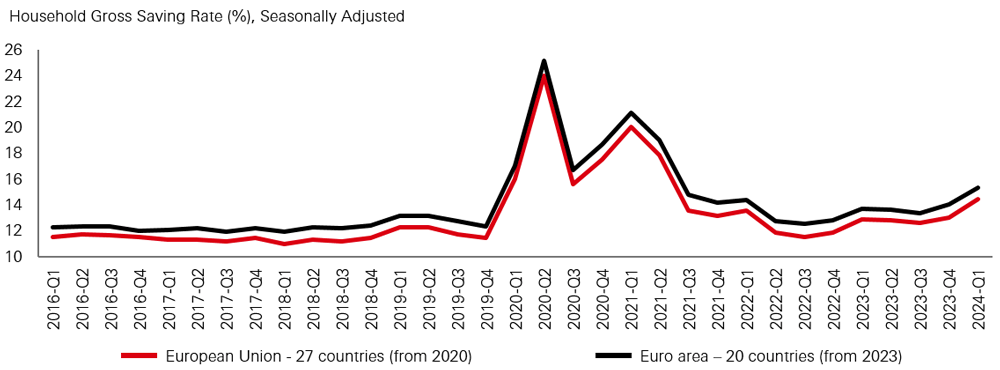
Source: Quarterly sector accounts - households - Statistics Explained (europa.eu)
After two ‘restriction free’ European Summers of extraordinarily strong recovery, some airlines are reporting the first signs of price sensitivity within leisure travel for Summer 2024.
While some of the bounce-back in travel has inevitably been helped by consumption of excess savings, a range of consumer behaviour surveys suggest that consumers have reprioritised the value they place on travel compared to before the pandemic, as shown in the data below.
Exhibit 6: Consumer survey results show continued strength of leisure travel intentions
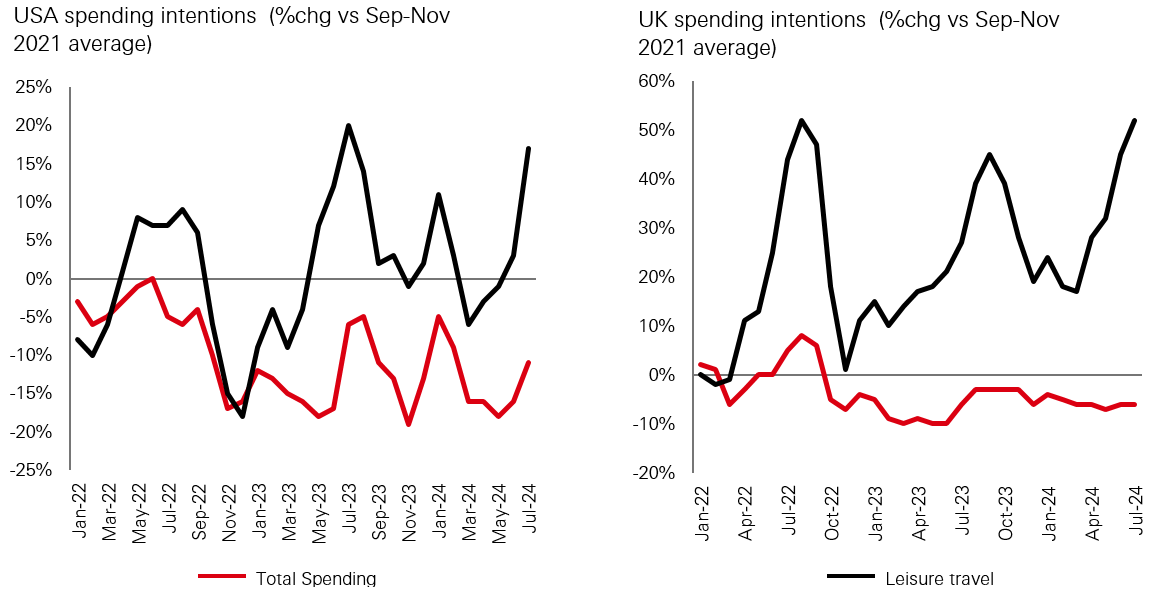
Source: 2024 travel outlook (deloitte.com)
Exhibit 7: US consumers protected travel spend even as financial conditions deteriorated
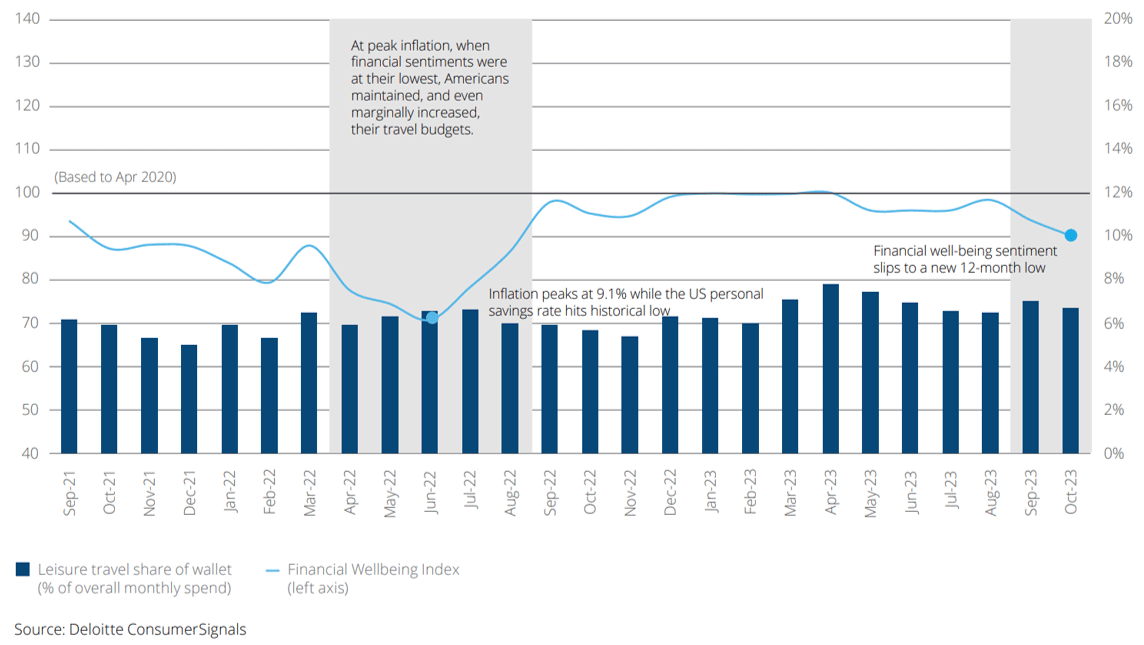
Source: 2024 travel outlook (deloitte.com)
This shift in behavioural intentions suggests that air travel is migrating, marginally, towards consumer staple rather than its traditional home in consumer discretionary.
Business travel – pros and cons
While there is no doubt that virtual meetings have reduced some demand for corporate travel, there may be more nuanced conclusions to be drawn.
Starting with the obvious, not all meetings can be replaced by virtual meetings. As data, and our own interactions suggest, some types of interaction are more substitutable than others. In general, for business development activities (i.e. client meetings, industry conferences, trade shows), physical attendance remains important. Furthermore, for cross-border activities (where air travel is most likely to be involved) and where cultural differences come into play, we see physical presence as difficult to substitute.
On the other hand, internal meetings, leadership presentations, and training courses are at high risk of substitution. We expect that this did not (and does not) represent more than a minority of air travel journeys.
Exhibit 8 which follows highlights that in both Europe and the USA, around 70% of companies expect their travel spending to be fully restored to 2019 levels in H2-24 (with a further 25%-30% expecting spending to return to greater than 75% of pre-COVID levels). This indicative of a modest impairment of demand, rather than a drastic reduction.
Exhibit 8: Corporate travel still in the rapid recovery phase – somewhat lagging leisure, but likely to level out at around 90% of previous levels
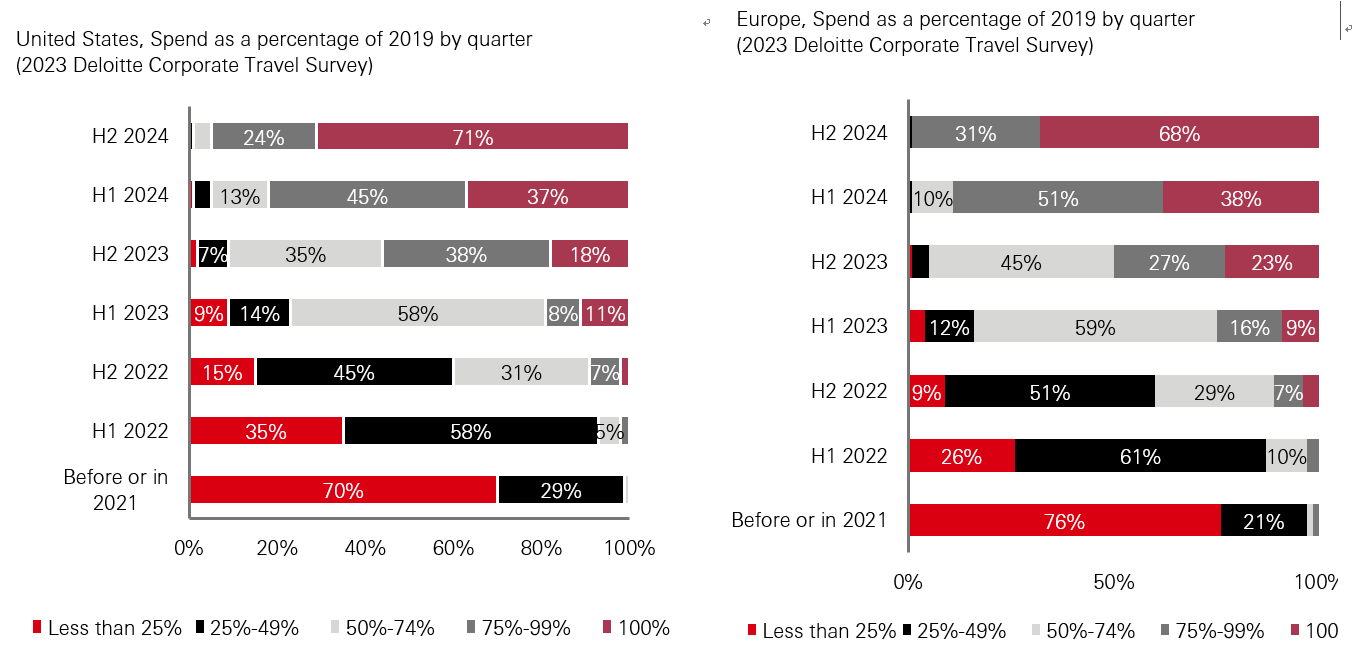
Source: Corporate travel study 2023 | Deloitte Insights
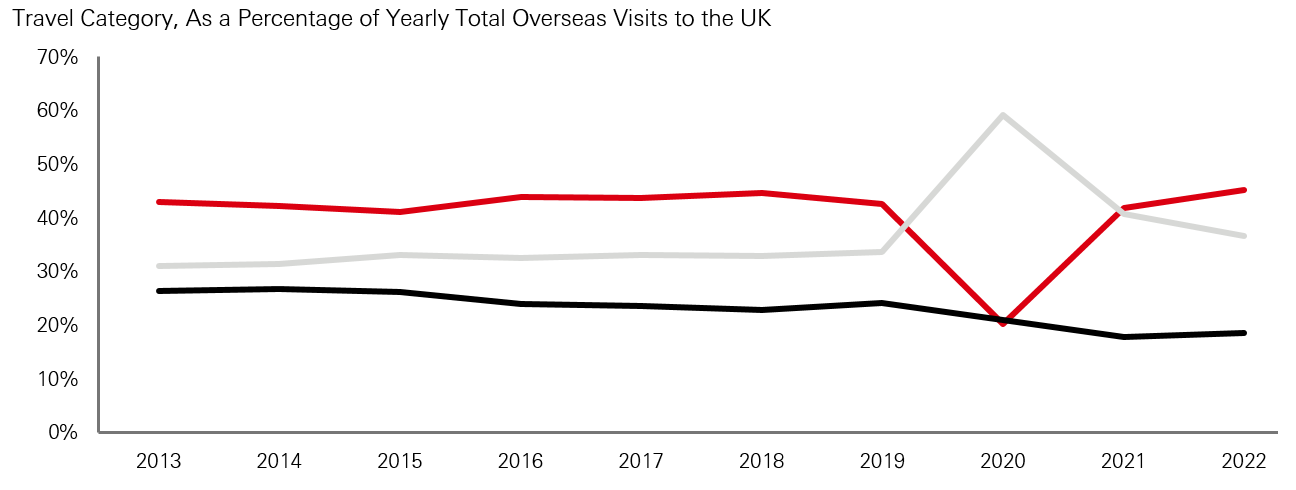
While travel for pure business purposes does seem set to be a lower proportion of the total than in the past, this is not a new trend. Business travel has been on a downward trend for many years (as a % of the total), with recessionary periods often causing an acceleration of its decline. This is important to highlight, as airlines have had many years to plan for this trend.
Exhibit 9: UK example highlights that business travel was already in relative decline prior to COVID
Source: UK ONS, Travel trends - Office for National Statistics (ons.gov.uk)
From an airport perspective, this decline in business traffic may be a revenue enhancer. While landing charges levied by airports do not distinguish between leisure or business, shopping behaviours of these groups tend to be quite different. A business traveller tends to arrive to the airport with little time to spare and migrate quickly towards a lounge, while leisure passengers tend to arrive sooner and be in a more relaxed state. The latter factors are conducive to shopping revenues generated by airports.
‘Bleisure travel’ – embracing flexibility
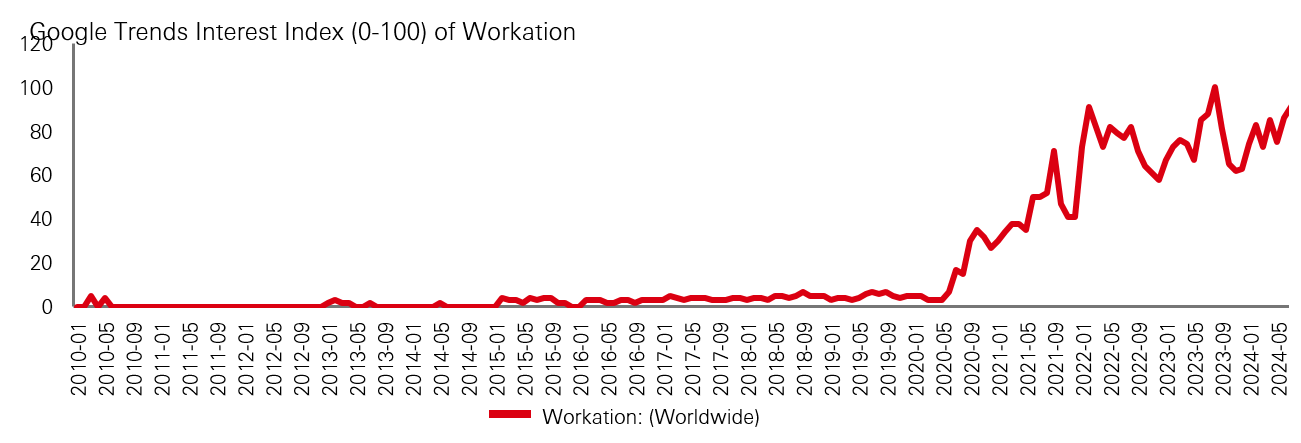
One of the least expected (and possibly least well known) trends to arise in the past 2-3 years is the amalgamation of business and leisure travel. This ‘bleisure’/’workation’ travel trend is embodied by those who travel to an overseas location accompanied by their laptops (and families) – extending their trip to ‘Work from Vacation’ for a period. These trips are not business-necessary (or paid for by employers) but are a way for travellers to maximise vacation allowances and potentially take more frequent trips than would be the case if they needed to be in the office. Destinations with (1) time zone coherence, (2) appealing climate, and; (3) well appointed hotels/apartments are likely beneficiaries of this trend. Regions which are set to benefit from this trend are Central America, Southern Europe, South Africa, and South East Asia.
Exhibit 10: Workation trend seems to have more durability than other pandemic-era inventions
Source: Google trends
The decentralisation of the Finance/Professional Services workspace has reduced the requirement for daily proximity to London/New York/Hong Kong; and has strengthened the appeal of secondary hubs such as Singapore, Florida, Milan, Paris, and Frankfurt, where lifestyle considerations can be more balanced. Contrary to reducing the need for business travel, we believe this trend is likely to increase demand for air travel at the expense of rail/car travel as daily commutes are replaced with weekly or monthly trips to the ‘head office’ or to stay in touch with industry peers.
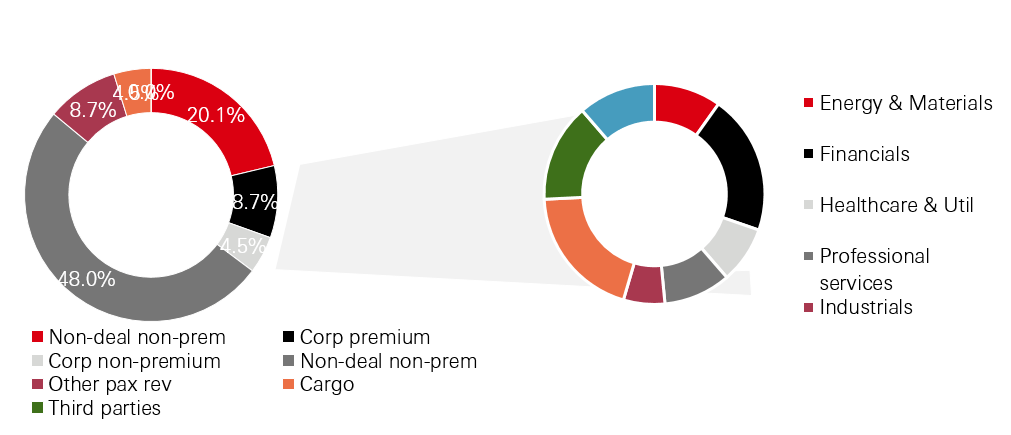
Exhibit 11: International business travel is dominated by a small number of knowledge intensive industries which are undergoing their own structural changes
Note: IAG = International Consolidated Airlines Group, the holding company of British Airways, Iberia, Aer Lingus, Vueling and Level.
Source: IAG Capital Markets Day 2019
Changing traveller mix and the impact on seasonality
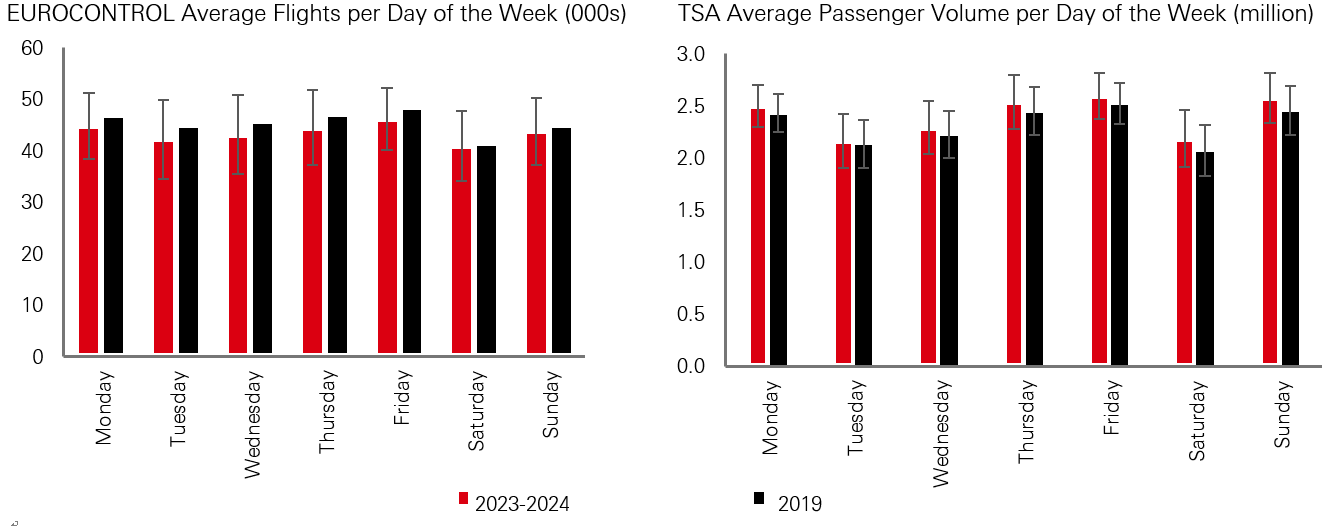
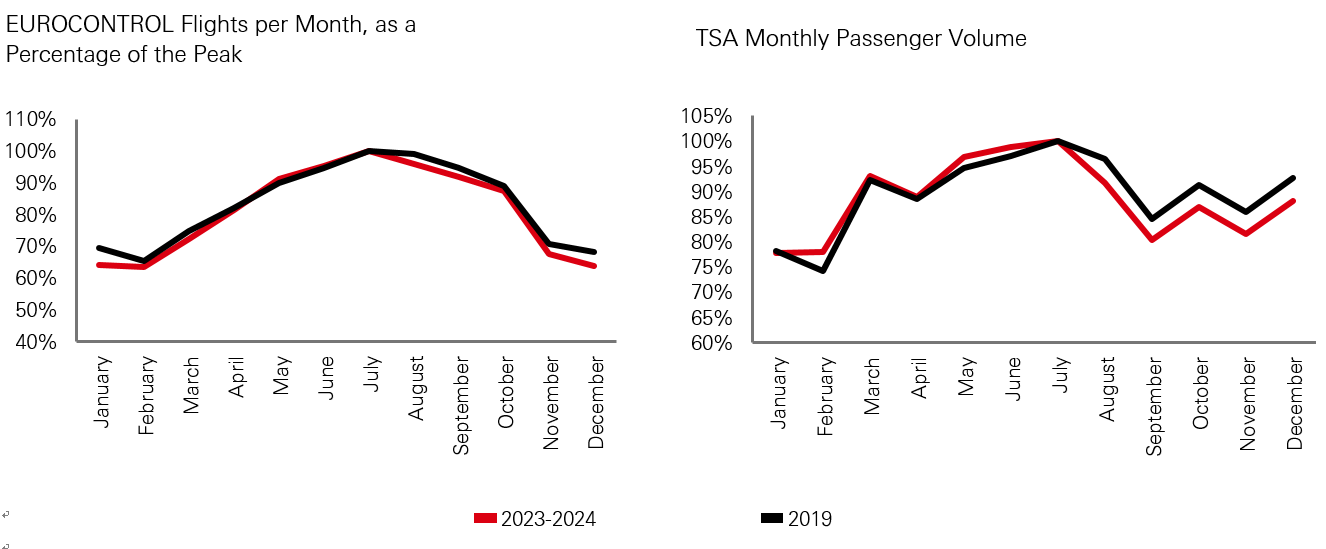
The corollary of business travel falling as a percentage of total travel is that leisure/VFR rises. Leisure travel tends to be characterised by larger peaks and troughs through the course of the year.Aviation, like many industries with high fixed costs, sees highest efficiency when demand is relatively stable throughout the week and throughout the seasons.As shown in the data below, there is already emerging evidence that certain days of the week are seeing higher peaks, and others deeper troughs. Extending this out to months of the year shows a similar trend.
Exhibit 12: Travel trends by day of week show slight shifts in the busiest days, but greater standard deviation
Source: EUROCONTROL
Source: TSA
Exhibit 13: Month-to-month comparison of aviation traffic shows emergence of new seasonal patterns
Source: EUROCONTROL
Source: TSA
For airports this is a trend that needs to be carefully monitored and planned for, i.e. ensuring that service quality remains consistently high without incurring excessive additional expenses (i.e. risk of falling asset utilisation as peak demand outgrows average demand).
Supply Chain complexity keeps supply/demand in check
Aircraft supply chains have developed to be global, complex and lean. While this has helped deliver leaps in aircraft development and production rates, the challenges presented by COVID are still reverberating.
Prior to 2019, Boeing delivered a peak number of 806 aircraft, while Airbus delivered 863. These rates were scaled back during the pandemic and have not been easy to restore; Boeing reaching around 65% of this production rate in 2023, and Airbus around 85%.
This has important implications for the aviation market considering that, had production rates remained stable there would have been a significant oversupply of aircraft in the market, potentially driving down prices and airline profitability.
Somewhat driven by circumstance rather than insightful planning, these delays in aircraft delivery have meant that the gap between demand (which took 3 years to recover to 2019 levels) and supply (which is still below pre-COVID levels) never led to a substantial consumer surplus. By contrast, while container shipping saw a demand boost during COVID but a large amount of supply arrived just as demand normalised, pushing the industry back into a more challenging position. Airlines faced significant funding challenges during the pandemic but have been able to restore, generally speaking, a sense of financial robustness through ticket pricing strength.
At the moment it remains unlikely that aircraft manufacturers will be able to contemplate a move to higher production rates. This will become increasingly necessary, as aviation grows at the same percentage CAGR, thus requiring a greater absolute number of new deliveries each year / per annum.
We estimate that net of retirements, the peak rate of supply can deliver approx. 1.5% growth in fleet, leaving airlines to meet a 4% demand CAGR through other means such as higher load factors, seat density and more intensive asset utilisation.
Sustainability focus – corporate commitments and regulatory constructs
Sustainability considerations for aviation have only risen over the past decade, and were accelerated during the pandemic.
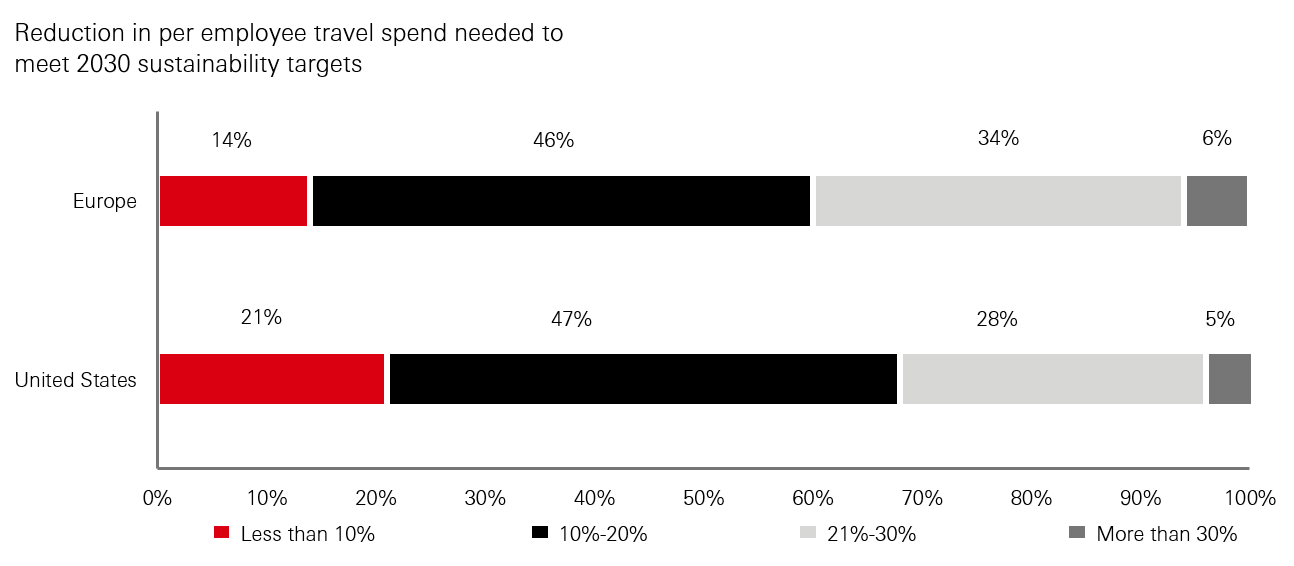
Many corporations’ emissions reductions commitments contain Scope 3 emissions, where business travel tends to be accounted for. As previously mentioned, business travel by air is concentrated on a handful of knowledge intensive industries. These industries’ emissions footprints tend to be heavily skewed towards employee travel and therefore net zero commitments made by companies have a direct implication on business travel.
Though the early phases of air travel recovery presented anecdotal evidence of large blue chip companies cutting back on travel for environmental reasons, this seems to have evolved into a more balanced approach between a pragmatic minimisation of travel combined with either the purchase of emissions reduction instruments /or travelling in a lower booking class (since business class emissions are up to 3x the emissions of economy class seats).
Exhibit 14: Corporate net zero commitments likely to have an impact on travel volumes, but only ~5% of companies foresee >30% reduction in travel
Source: 2023 Deloitte Corporate Travel Survey, Corporate travel study 2023 | Deloitte Insights
In addition to the market-based response to sustainability concerns described above, the response of regulators and legislators has also been significant. Aviation (particularly in Europe) has seen a marked step up in instruments pricing the industries’ emissions, to the extent that by the end of the 2020s, the industry will have;
- No ‘free’ emissions under EU ETS,
- An industry-wide emissions offsetting scheme (for international flights),
- Mandated Sustainable Aviation Fuel requirements,
- Higher taxation on the aviation fuel it requires to operate.
Combining these effects without an offsetting increase in ticket prices could pose significant profitability challenges in an already ‘low margin’ industry.
While the contribution of an airport’s emissions in the aviation value chain are small, the industry does bear volume risk. Therefore should the airline sector focus on higher priced tickets at the expense of volume, this could impact the airport sector negatively.
The contribution of airports to the aviation value chain’s emissions is relatively small. Eliminating these emissions does not require new technologies and can be achieved relatively quickly. However, planning timelines for airports are very long term, thirty years and above for a new terminal is not atypical. This forces airports to invest their expansion capital today wisely. Aeroports de Paris has already scaled back plans to add an additional terminal at Charles de Gaulle primarily due to sustainability reasons, focusing instead on enhancing the existing asset base.
Airport expansion in developed markets is rarely straightforward – benefits of greater connectivity accrue across a region/nation but the costs (noise, traffic, pollution) are borne by local residents. This makes approval processes lengthy and controversial – sustainability considerations are likely to further complicate the ability of airports to grow their footprint. Instead it is likely that expansion could be more modular and incremental in nature, which may reduce the cyclicality of shareholder cashflows.
Trends already underway – powerful factors for the 10 year view
Although air travel displays some correlation with the economic cycle, there are a handful of powerful dynamics driving growth in what could otherwise become a mature market.
Even in developed markets where, ceteris paribus, economic growth may not lead to disproportionate growth in air travel; we see upside kickers from demography, aircraft technology and airline innovation. We expect these to support above-GDP growth in travel demand for many years.
OK boomer - changing attitudes
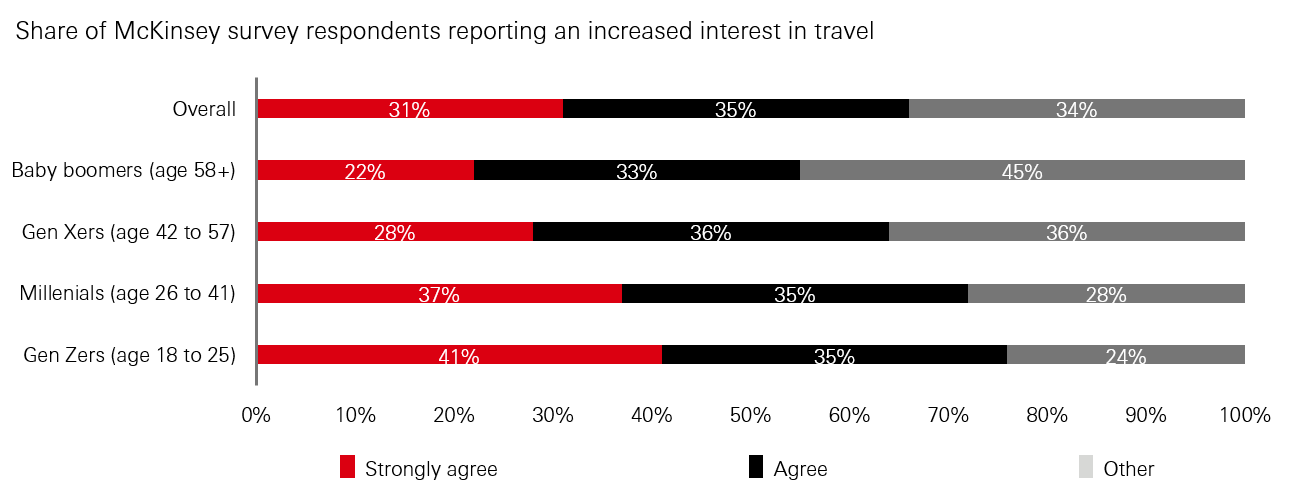
Not to be confused with an ageing demographic, generational cohorts appear to be carrying different attitudes as they age. As highlighted below, there is a marked difference in interest in travel among younger generations compared to their parents and grandparents.
Exhibit 15: Gen Z, the FOMO generation’s interest in travel is relatively high
Source: McKinsey State of Travel Survey, Feb 27-Mar 11, 2024. The way we travel now | McKinsey
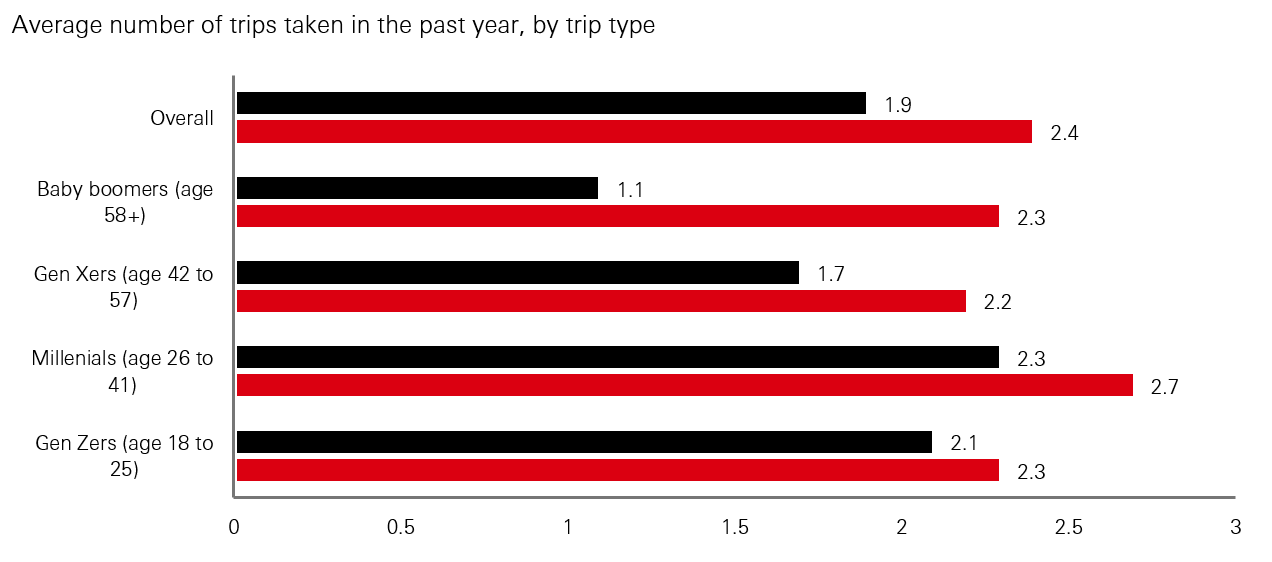
Exhibit 16: International travel disproportionately favoured by younger cohorts
Source: McKinsey State of Travel Survey, Feb 27-Mar 11, 2024, The way we travel now | McKinsey
The important implication of these generational differences for airports is that the demand for international travel, even in developed markets, is likely to outstrip population growth. The same cannot be said for all forms of transport, with younger generations showing lower interest in car ownership, for example.
New aircraft technology – opening thinner routes creating more city pairs
While the pandemic saw accelerated retirements of the largest aircraft in the skies, the Boeing 747 and Airbus A380; the reality is that this was a trend already well underway. The classic Jumbo Jet first entered service in 1970 – since then there have been many developments in materials and propulsion technology.
The current order backlogs for Airbus and Boeing are dominated by twin-engine jets. These are lighter (so can land on shorter runways at smaller airports), smaller (need fewer passengers to be filled) and have 30-50% better fuel efficiency (lower operating cost) – but without sacrificing on range.
This enables airlines to operate profitably on routes outside of major airport hubs, and connect countries that have never previously had direct flight connections.
We expect this to mean a move away from hub-and-spoke operation, and to benefit smaller ‘gateway’ airports – i.e. capital cities of medium sized countries.
For airport investors this will likely require careful evaluation of the competitive positioning of an asset to this trend.
Exhibit 17: Old vs New comparison for aircraft – fewer seats but no sacrifice on range

Exhibit 18: Growth in ‘unique city pairs’ indicates the fading appeal of megahub airports
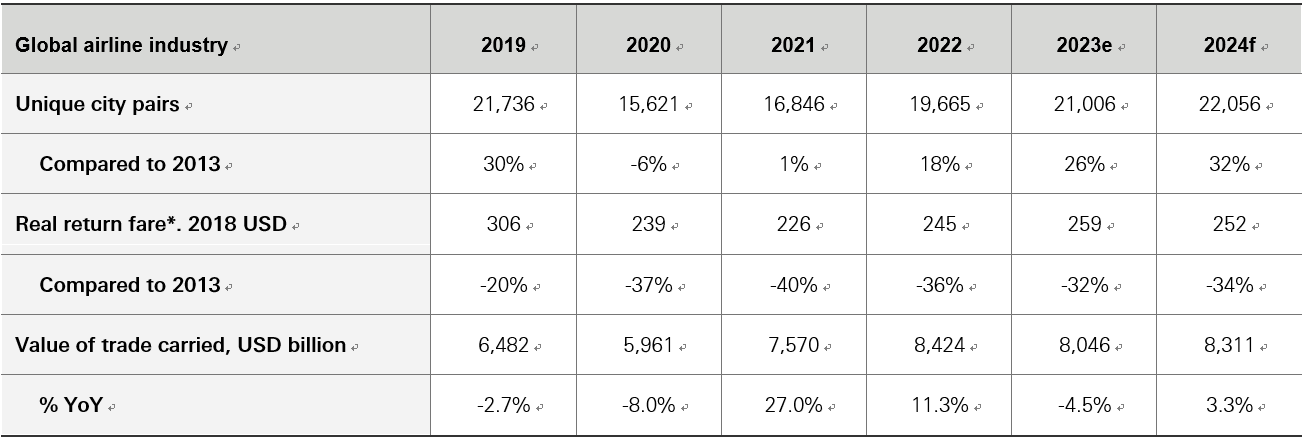
*Including ancillary revenue
Source: IATA Sustainability and Economics, iata.org/en/iata-repository/publications/economic-reports/global-outlook-for-air-transport-june-2024-report/
VFR – the unheralded travel superpower
While there may be greater uncertainty about the outlook for globalisation of capital, demographic forces make it highly doubtful there will be a slowdown in the globalisation of labour.
It is not a new insight to note that ageing populations create labour shortfalls. The model most commonly employed around the globe to date to solve this has been economic migration. This has created a vast, global network of friends and families who regularly travel back and forth to stay in touch. In the UK, overseas travel to visit friends and relative accounts for around 35% of inbound visitors, a huge contribution to air travel.
While greater workforce automation may solve some of these labour shortfalls, it is likely that the requirement for internationally mobile labour will continue or even become more important, driving additional demand for air travel.
Exhibit 19: Ageing population = potential workforce undersupply
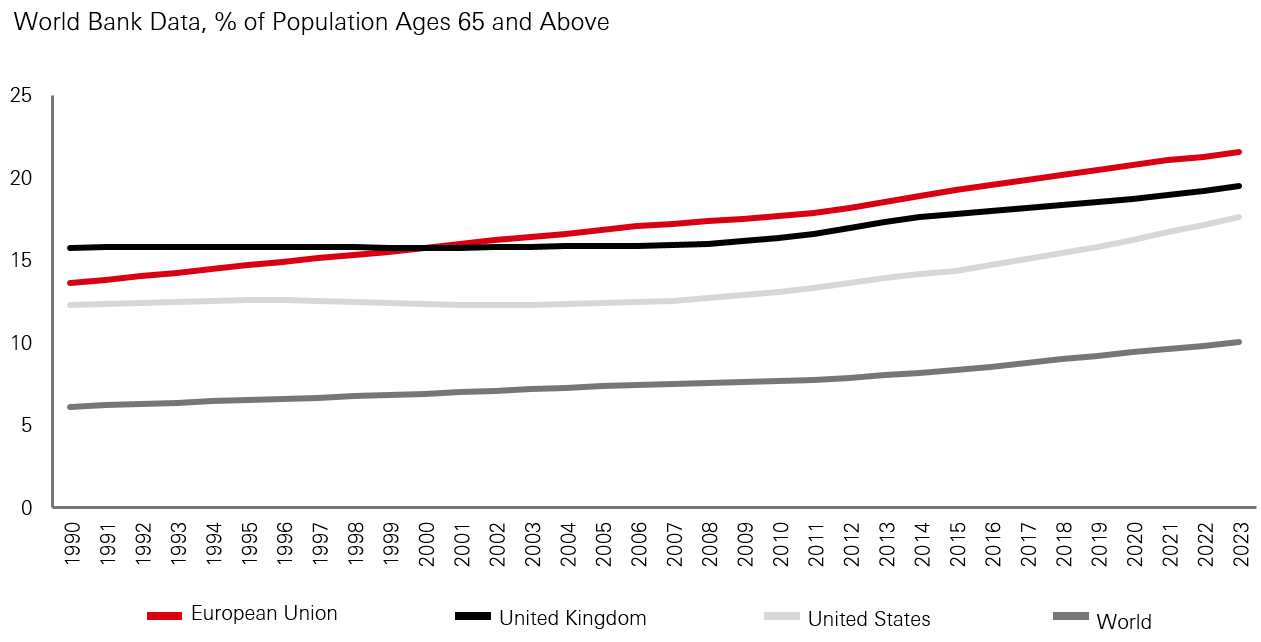
Source: World bank data
Exhibit 20: Long upward trend in international immigration
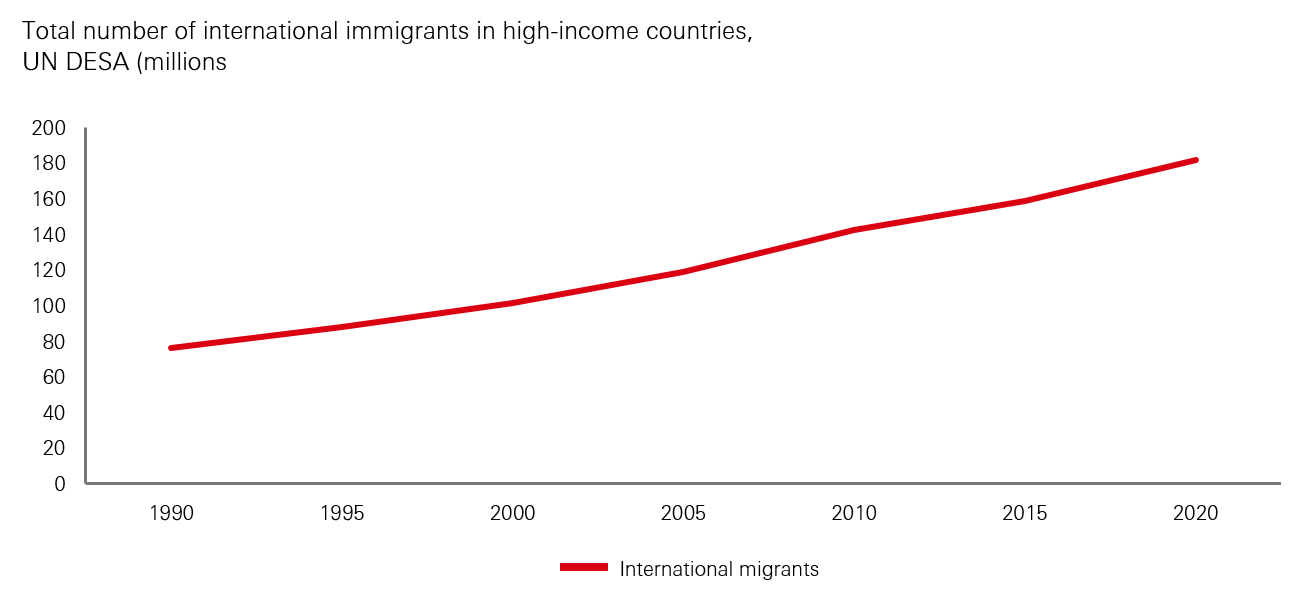
Source: Migration - Our World in Data
The long term outlook
Though the pandemic gave rise to a number of challenges over the medium term, it has also created new opportunities.
While there are likely to be some permanent shifts in demand patterns as a result, the key drivers for above-GDP growth will, in our view, remain firmly intact and in some cases, enhanced.
This has a range of implications for stakeholders in aviation. Consumers may face higher prices but benefit from a wider range of destinations. Airlines may need to rethink the product offering for premium cabins and consider a lower reliance on hubs. For infrastructure, and particularly airport investors, we see multiple opportunities;
- Wealth and demographic effects supporting above-GDP growth rates
- Higher retail spend – leisure travellers tend to spend more in airport shops than business travellers; this could be a tailwind for non-regulated profits
- Higher retail spend (2) - The trend to accumulation of experiences vs. goods appears to have been accelerated exiting the pandemic, making the value of a leisure traveller’s ‘dwell time’ in an airport particularly valuable (opportunity to spend). Airports may need to develop experiential and unique attractions alongside the traditional hard retail approach.
- Lounge use – traditionally rented out to airlines and reserved for premium customers, we see space for a directly operated ‘pay per use’ lounge to become more prominent
- Seasonality enhanced – requiring smart resource planning to avoid poor service quality and also additional costs
- Care on capital allocation – airlines achieve high yields at peak times, this drives demand for peak capacity rather than average capacity. Airports should be careful to ensure this peak demand is properly remunerated.
Disclaimer
For Professional Clients and intermediaries within countries and territories set out below, and for Institutional Investors and Financial Advisors in the US. This document should not be distributed to or relied upon by Retail clients/investors.
The value of investments and the income from them can go down as well as up and investors may not get back the amount originally invested. The performance figures contained in this document relate to past performance, which should not be seen as an indication of future returns. Future returns will depend, inter alia, on market conditions, investment manager’s skill, risk level and fees. Where overseas investments are held the rate of currency exchange may cause the value of such investments to go down as well as up. Investments in emerging markets are by their nature higher risk and potentially more volatile than those inherent in some established markets. Economies in Emerging Markets generally are heavily dependent upon international trade and, accordingly, have been and may continue to be affected adversely by trade barriers, exchange controls, managed adjustments in relative currency values and other protectionist measures imposed or negotiated by the countries and territories with which they trade. These economies also have been and may continue to be affected adversely by economic conditions in the countries and territories in which they trade.
The contents of this document may not be reproduced or further distributed to any person or entity, whether in whole or in part, for any purpose. All non-authorised reproduction or use of this document will be the responsibility of the user and may lead to legal proceedings. The material contained in this document is for general information purposes only and does not constitute advice or a recommendation to buy or sell investments. Some of the statements contained in this document may be considered forward looking statements which provide current expectations or forecasts of future events. Such forward looking statements are not guarantees of future performance or events and involve risks and uncertainties. Actual results may differ materially from those described in such forward-looking statements as a result of various factors. We do not undertake any obligation to update the forward-looking statements contained herein, or to update the reasons why actual results could differ from those projected in the forward-looking statements. This document has no contractual value and is not by any means intended as a solicitation, nor a recommendation for the purchase or sale of any financial instrument in any jurisdiction in which such an offer is not lawful. The views and opinions expressed herein are those of HSBC Asset Management at the time of preparation and are subject to change at any time. These views may not necessarily indicate current portfolios' composition. Individual portfolios managed by HSBC Asset Management primarily reflect individual clients' objectives, risk preferences, time horizon, and market liquidity. Foreign and emerging markets. Investments in foreign markets involve risks such as currency rate fluctuations, potential differences in accounting and taxation policies, as well as possible political, economic, and market risks. These risks are heightened for investments in emerging markets which are also subject to greater illiquidity and volatility than developed foreign markets. This commentary is for information purposes only. It is a marketing communication and does not constitute investment advice or a recommendation to any reader of this content to buy or sell investments nor should it be regarded as investment research. It has not been prepared in accordance with legal requirements designed to promote the independence of investment research and is not subject to any prohibition on dealing ahead of its dissemination. This document is not contractually binding nor are we required to provide this to you by any legislative provision.
All data from HSBC Asset Management unless otherwise specified. Any third-party information has been obtained from sources we believe to be reliable, but which we have not independently verified.
HSBC Asset Management is the brand name for the asset management business of HSBC Group, which includes the investment activities that may be provided through our local regulated entities. HSBC Asset Management is a group of companies in many countries and territories throughout the world that are engaged in investment advisory and fund management activities, which are ultimately owned by HSBC Holdings Plc. (HSBC Group). The above communication is distributed by the following entities:
- In Argentina by HSBC Global Asset Management Argentina S.A., Sociedad Gerente de Fondos Comunes de Inversión, Agente de administración de productos de inversión colectiva de FCI N°1;
- In Australia, this document is issued by HSBC Bank Australia Limited ABN 48 006 434 162, AFSL 232595, for HSBC Global Asset Management (Hong Kong) Limited ARBN 132 834 149 and HSBC Global Asset Management (UK) Limited ARBN 633 929 718. This document is for institutional investors only and is not available for distribution to retail clients (as defined under the Corporations Act). HSBC Global Asset Management (Hong Kong) Limited and HSBC Global Asset Management (UK) Limited are exempt from the requirement to hold an Australian financial services license under the Corporations Act in respect of the financial services they provide. HSBC Global Asset Management (Hong Kong) Limited is regulated by the Securities and Futures Commission of Hong Kong under the Hong Kong laws, which differ from Australian laws. HSBC Global Asset Management (UK) Limited is regulated by the Financial Conduct Authority of the United Kingdom and, for the avoidance of doubt, includes the Financial Services Authority of the United Kingdom as it was previously known before 1 April 2013, under the laws of the United Kingdom, which differ from Australian laws;
- in Bermuda by HSBC Global Asset Management (Bermuda) Limited, of 37 Front Street, Hamilton, Bermuda which is licensed to conduct investment business by the Bermuda Monetary Authority;
- in Chile: Operations by HSBC's headquarters or other offices of this bank located abroad are not subject to Chilean inspections or regulations and are not covered by warranty of the Chilean state. Further information may be obtained about the state guarantee to deposits at your bank or on www.sbif.cl;
- in Colombia: HSBC Bank USA NA has an authorized representative by the Superintendencia Financiera de Colombia (SFC) whereby its activities conform to the General Legal Financial System. SFC has not reviewed the information provided to the investor. This document is for the exclusive use of institutional investors in Colombia and is not for public distribution;
- in Finland, Norway, Denmark and Sweden by HSBC Global Asset Management (France), a Portfolio Management Company authorised by the French regulatory authority AMF (no. GP99026) and through the Stockholm branch of HSBC Global Asset Management (France), regulated by the Swedish Financial Supervisory Authority (Finansinspektionen);
- in France, Belgium, Netherlands, Luxembourg, Portugal, Greece by HSBC Global Asset Management (France), a Portfolio Management Company authorised by the French regulatory authority AMF (no. GP99026);
- in Germany by HSBC Global Asset Management (Deutschland) GmbH which is regulated by BaFin (German clients) respective by the Austrian Financial Market Supervision FMA (Austrian clients);
- in Hong Kong by HSBC Global Asset Management (Hong Kong) Limited, which is regulated by the Securities and Futures Commission. This video/content has not be reviewed by the Securities and Futures Commission;
- in India by HSBC Asset Management (India) Pvt Ltd. which is regulated by the Securities and Exchange Board of India;
- in Italy and Spain by HSBC Global Asset Management (France), a Portfolio Management Company authorised by the French regulatory authority AMF (no. GP99026) and through the Italian and Spanish branches of HSBC Global Asset Management (France), regulated respectively by Banca d’Italia and Commissione Nazionale per le Società e la Borsa (Consob) in Italy, and the Comisión Nacional del Mercado de Valores (CNMV) in Spain;
- in Malta by HSBC Global Asset Management (Malta) Limited which is regulated and licensed to conduct Investment Services by the Malta Financial Services Authority under the Investment Services Act;
- in Mexico by HSBC Global Asset Management (Mexico), SA de CV, Sociedad Operadora de Fondos de Inversión, Grupo Financiero HSBC which is regulated by Comisión Nacional Bancaria y de Valores;
- in the United Arab Emirates, Qatar, Bahrain & Kuwait by HSBC Global Asset Management MENA, a unit within HSBC Bank Middle East Limited, U.A.E Branch, PO Box 66 Dubai, UAE, regulated by the Central Bank of the U.A.E. and the Securities and Commodities Authority in the UAE under SCA license number 602004 for the purpose of this promotion and lead regulated by the Dubai Financial Services Authority. HSBC Bank Middle East Limited is a member of the HSBC Group and HSBC Global Asset Management MENA are marketing the relevant product only in a sub-distributing capacity on a principal-to-principal basis. HSBC Global Asset Management MENA may not be licensed under the laws of the recipient’s country of residence and therefore may not be subject to supervision of the local regulator in the recipient’s country of residence. One of more of the products and services of the manufacturer may not have been approved by or registered with the local regulator and the assets may be booked outside of the recipient’s country of residence.
- in Peru: HSBC Bank USA NA has an authorized representative by the Superintendencia de Banca y Seguros in Perú whereby its activities conform to the General Legal Financial System - Law No. 26702. Funds have not been registered before the Superintendencia del Mercado de Valores (SMV) and are being placed by means of a private offer. SMV has not reviewed the information provided to the investor. This document is for the exclusive use of institutional investors in Perú and is not for public distribution;
- in Singapore by HSBC Global Asset Management (Singapore) Limited, which is regulated by the Monetary Authority of Singapore. The content in the document/video has not been reviewed by the Monetary Authority of Singapore;
- in Switzerland by HSBC Global Asset Management (Switzerland) AG. This document is intended for professional investor use only. For opting in and opting out according to FinSA, please refer to our website; if you wish to change your client categorization, please inform us. HSBC Global Asset Management (Switzerland) AG having its registered office at Gartenstrasse 26, PO Box, CH-8002 Zurich has a licence as an asset manager of collective investment schemes and as a representative of foreign collective investment schemes. Disputes regarding legal claims between the Client and HSBC Global Asset Management (Switzerland) AG can be settled by an ombudsman in mediation proceedings. HSBC Global Asset Management (Switzerland) AG is affiliated to the ombudsman FINOS having its registered address at Talstrasse 20, 8001 Zurich. There are general risks associated with financial instruments, please refer to the Swiss Banking Association (“SBA”) Brochure “Risks Involved in Trading in Financial Instruments”;
- in Taiwan by HSBC Global Asset Management (Taiwan) Limited which is regulated by the Financial Supervisory Commission R.O.C. (Taiwan);
- in the UK by HSBC Global Asset Management (UK) Limited, which is authorised and regulated by the Financial Conduct Authority;
- and in the US by HSBC Global Asset Management (USA) Inc. which is an investment adviser registered with the US Securities and Exchange Commission.
- In Uruguay, operations by HSBC's headquarters or other offices of this bank located abroad are not subject to Uruguayan inspections or regulations and are not covered by warranty of the Uruguayan state. Further information may be obtained about the state guarantee to deposits at your bank or on www.bcu.gub.uy.
NOT FDIC INSURED ◆ NO BANK GUARANTEE ◆ MAY LOSE VALUE
Copyright © HSBC Global Asset Management Limited 2024. All rights reserved. No part of this publication may be reproduced, stored in a retrieval system, or transmitted, on any form or by any means, electronic, mechanical, photocopying, recording, or otherwise, without the prior written permission of HSBC Global Asset Management Limited.
1243-24; Exp 31.10.2025


